
Our Work
Our team has created empirical data visualizations that educate the public on the pandemic's ongoing impact and display information from multiple, often overlooked angles such as climate implications, socioeconomic factors, and social aspects.
Featured Projects

Inequalities Projects
The Inequalities Projects is focused on education and food insecurity. The education project strives to understand how the lack of access to e-learning and school-provided meals effected under-resourced populations during the pandemic. The food insecurity project intends to create visualizations and write articles to inform the mass public as well as nonprofit food entities on how food insecurity has been impacted by the aftereffects of COVID-19.
›
Image Source: Chicago Booth Review
Visualizations
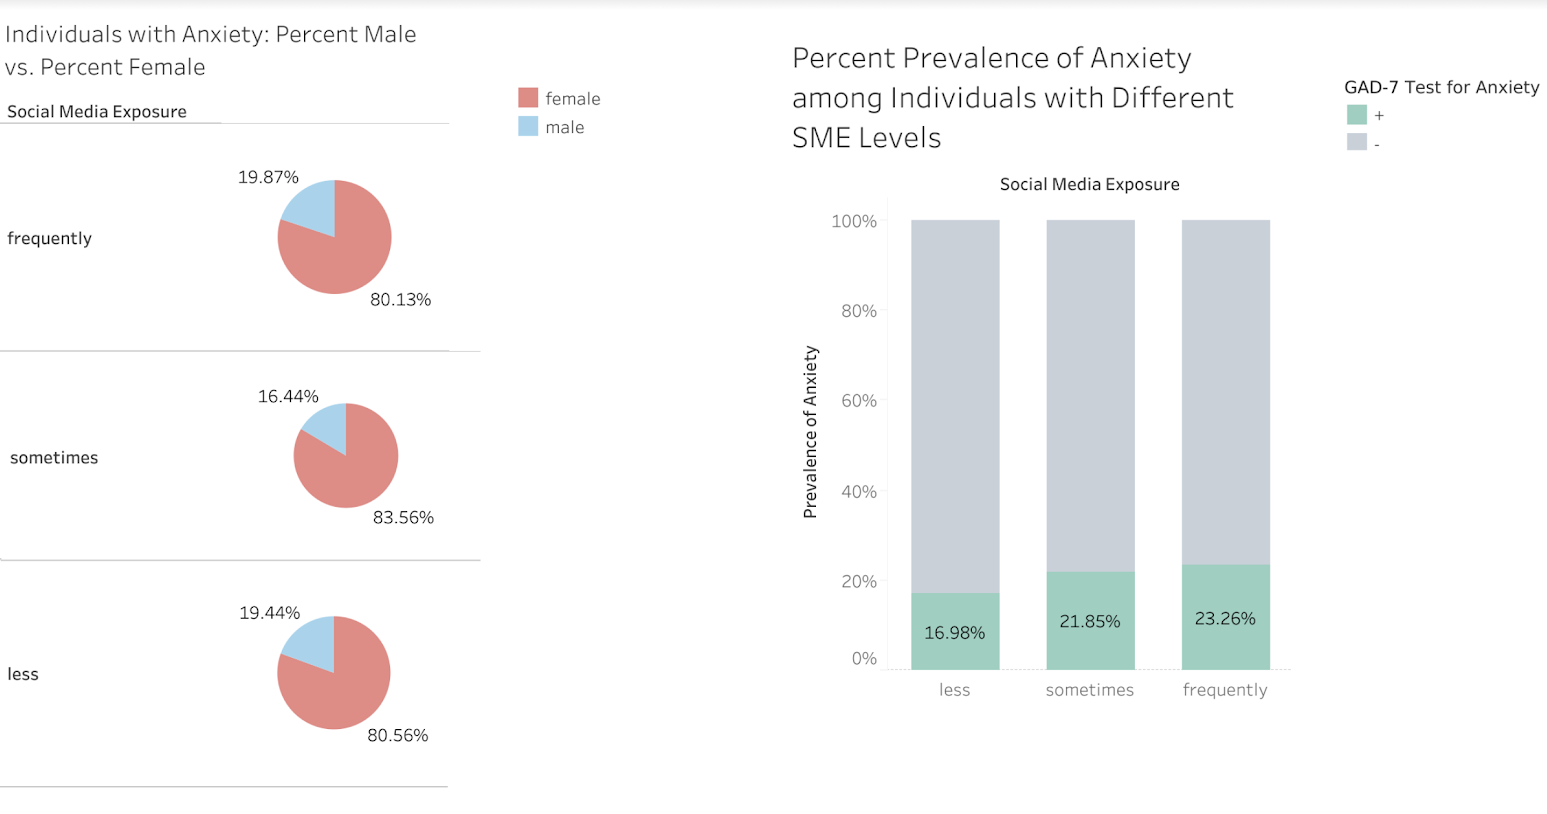
Anxiety Prevalence
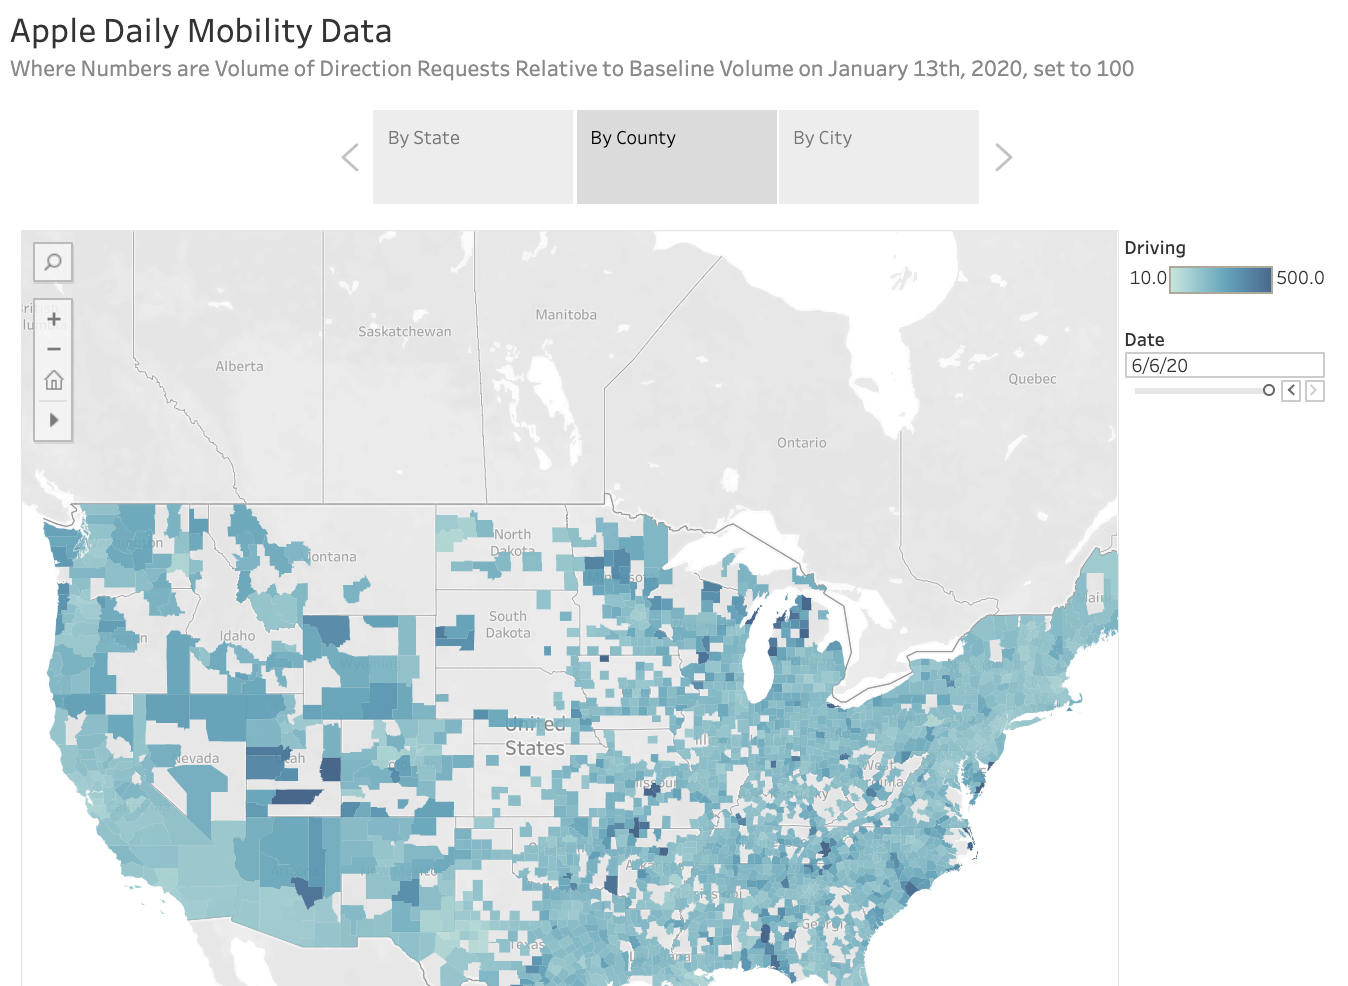
Apple Daily Mobility Data
Brazil Case Overview per State

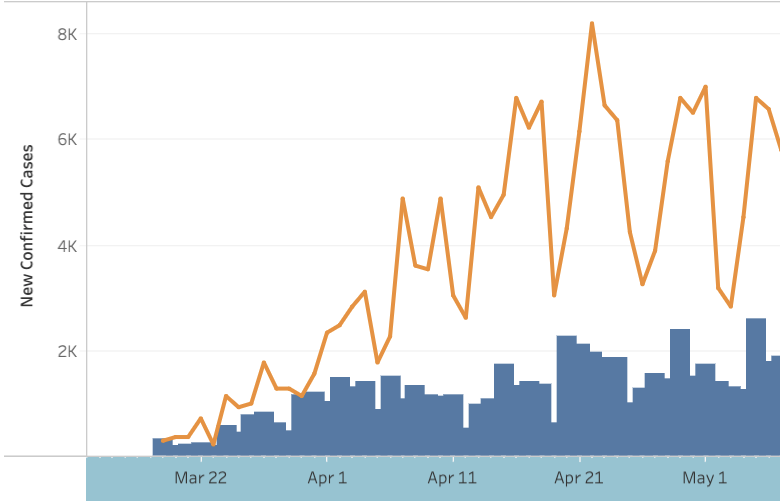
Case Spike in California
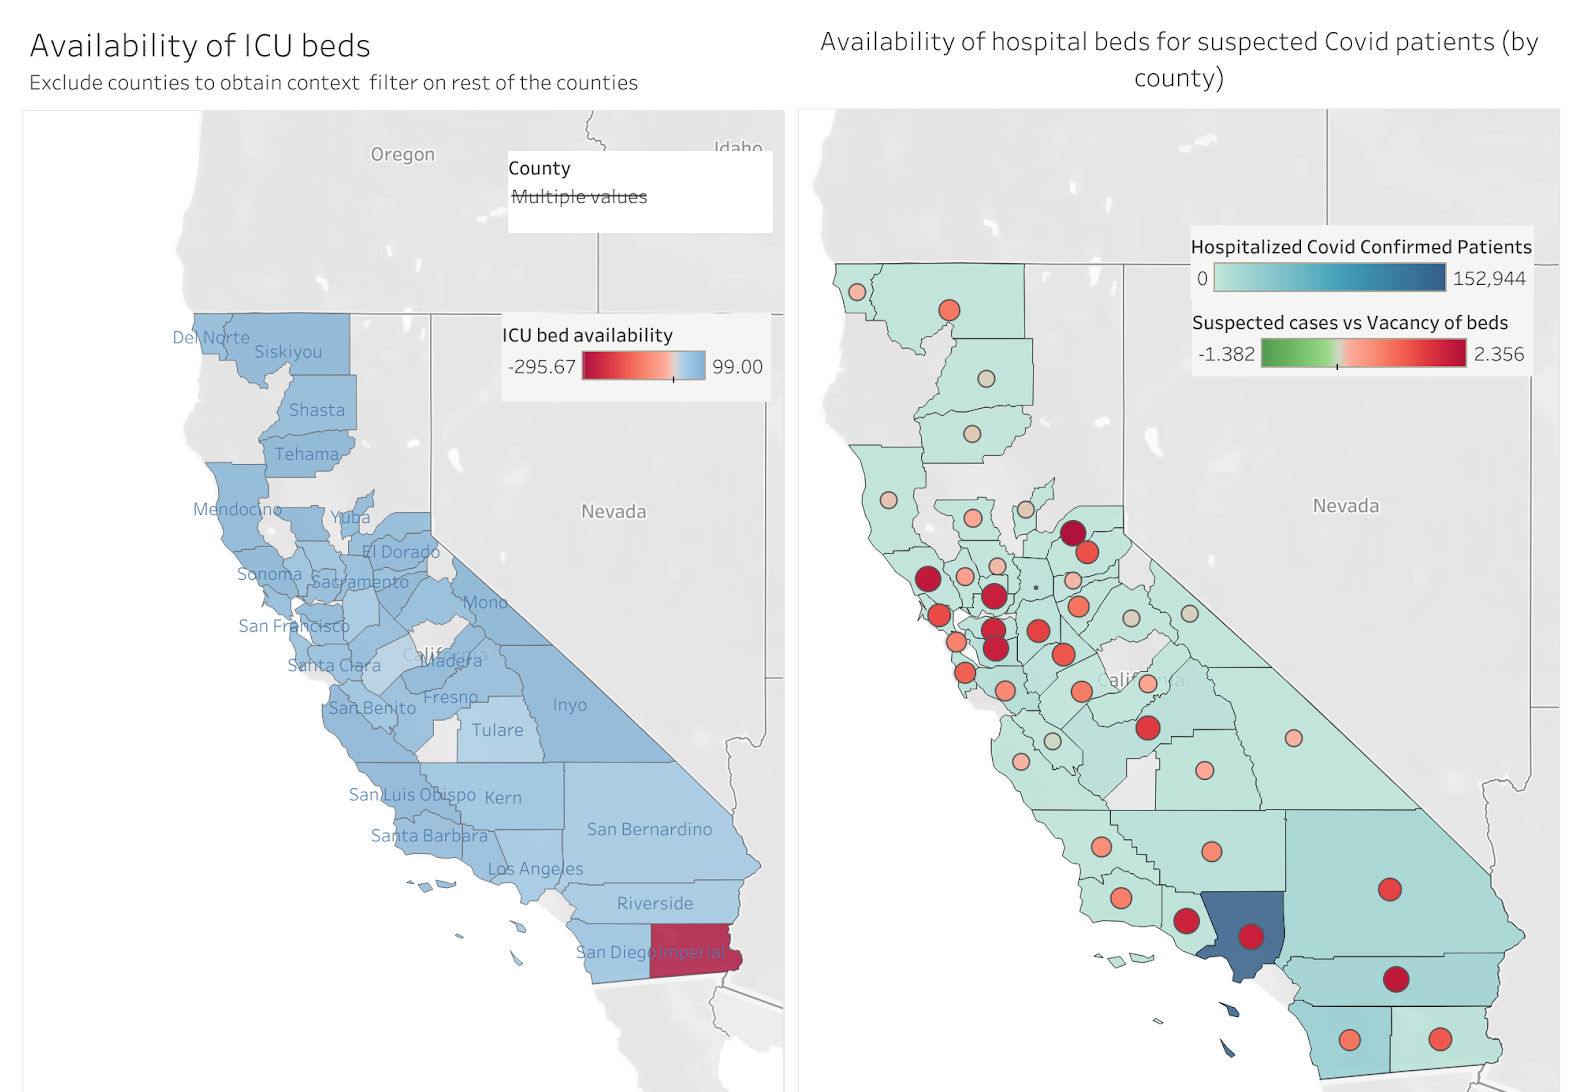
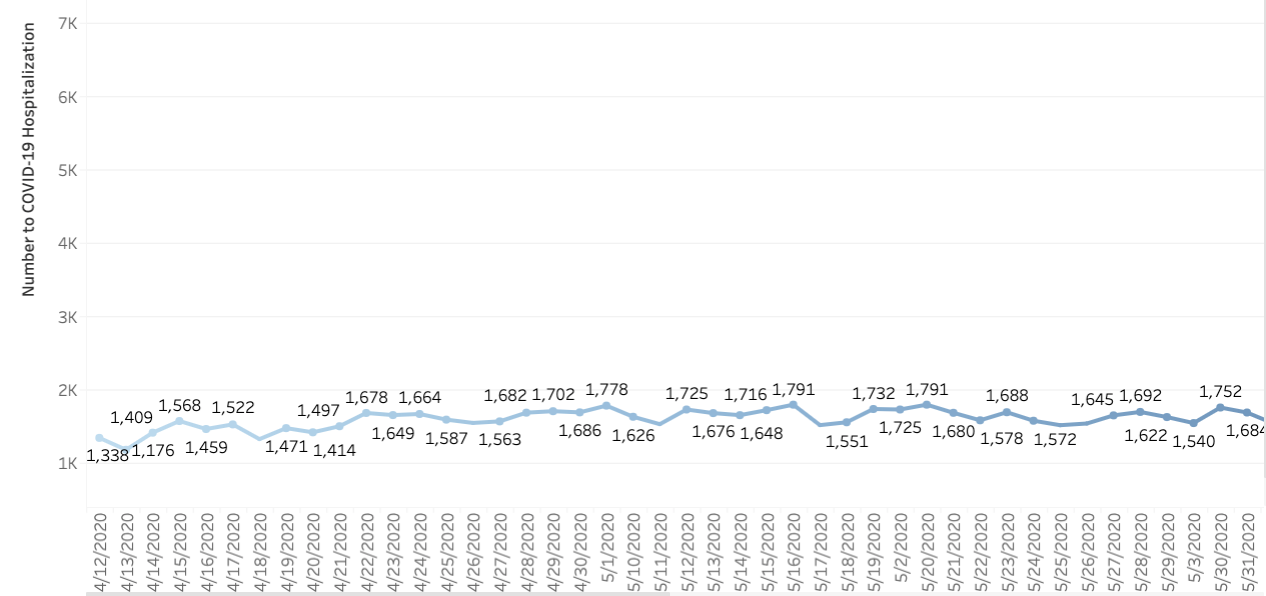
COVID-19 Patient and Hospitalization (California)
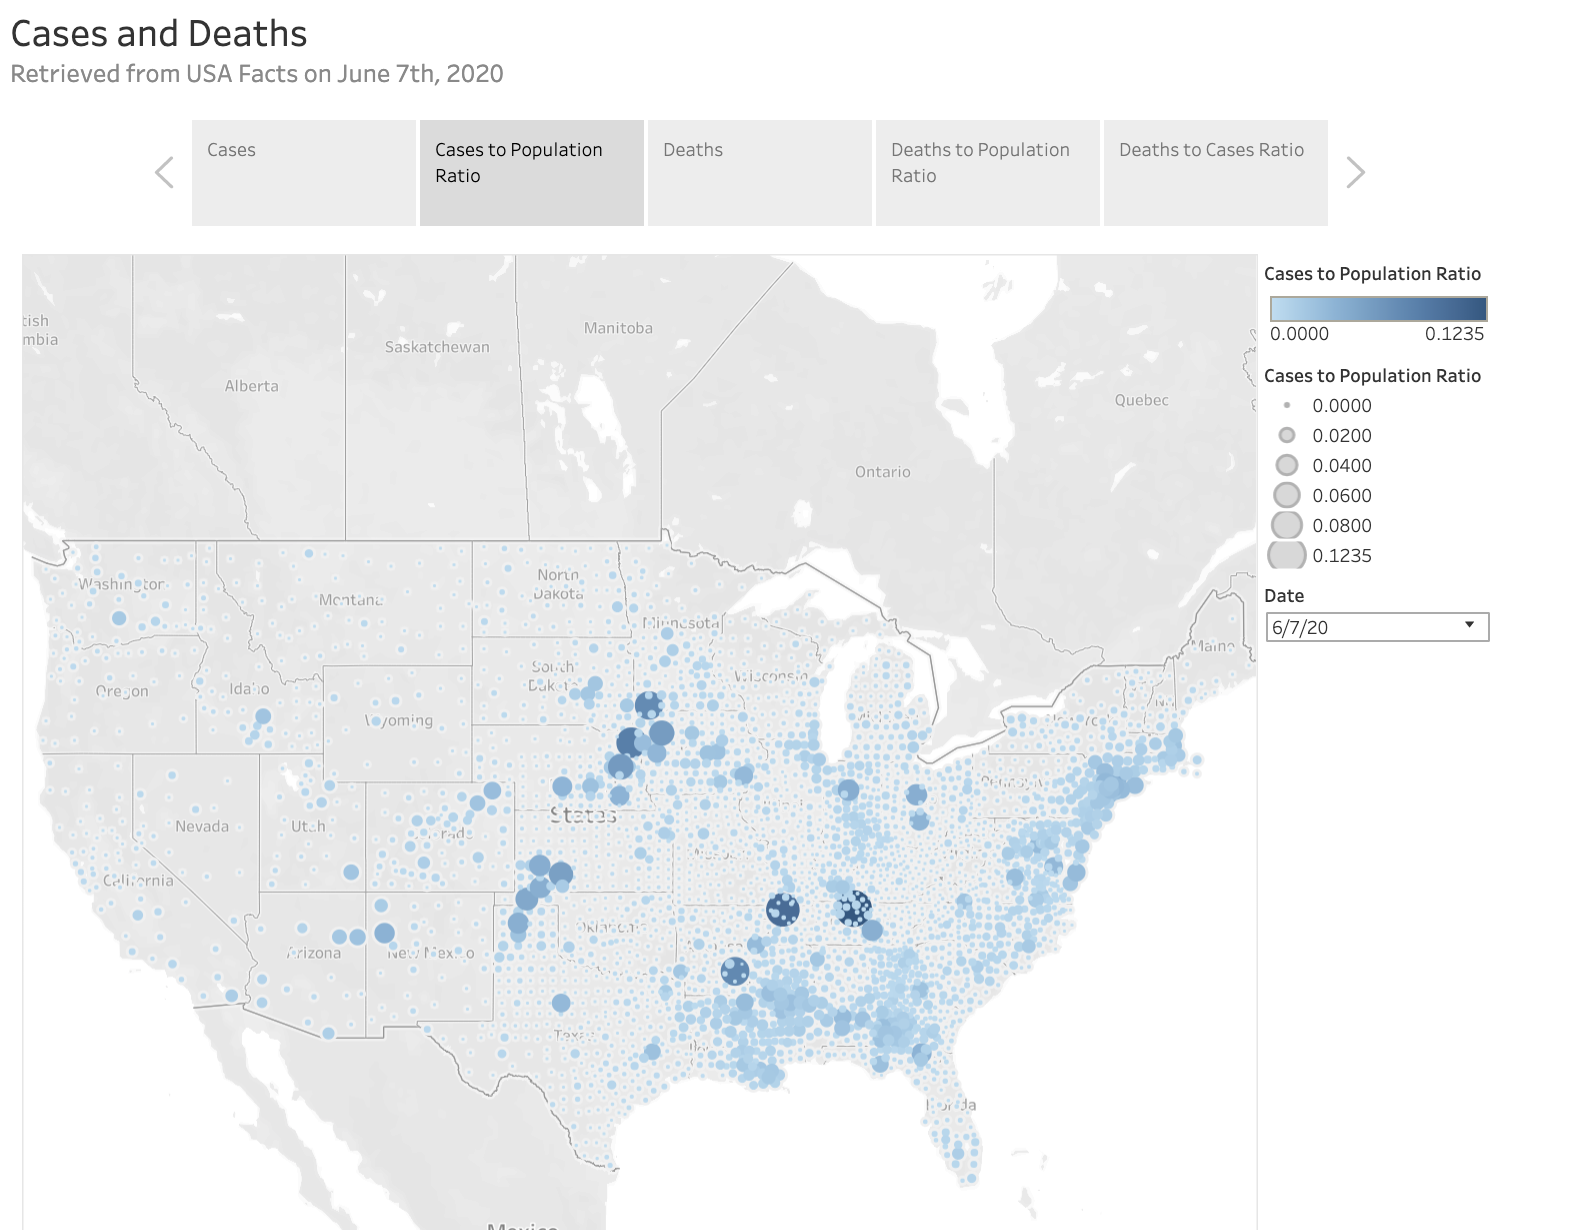
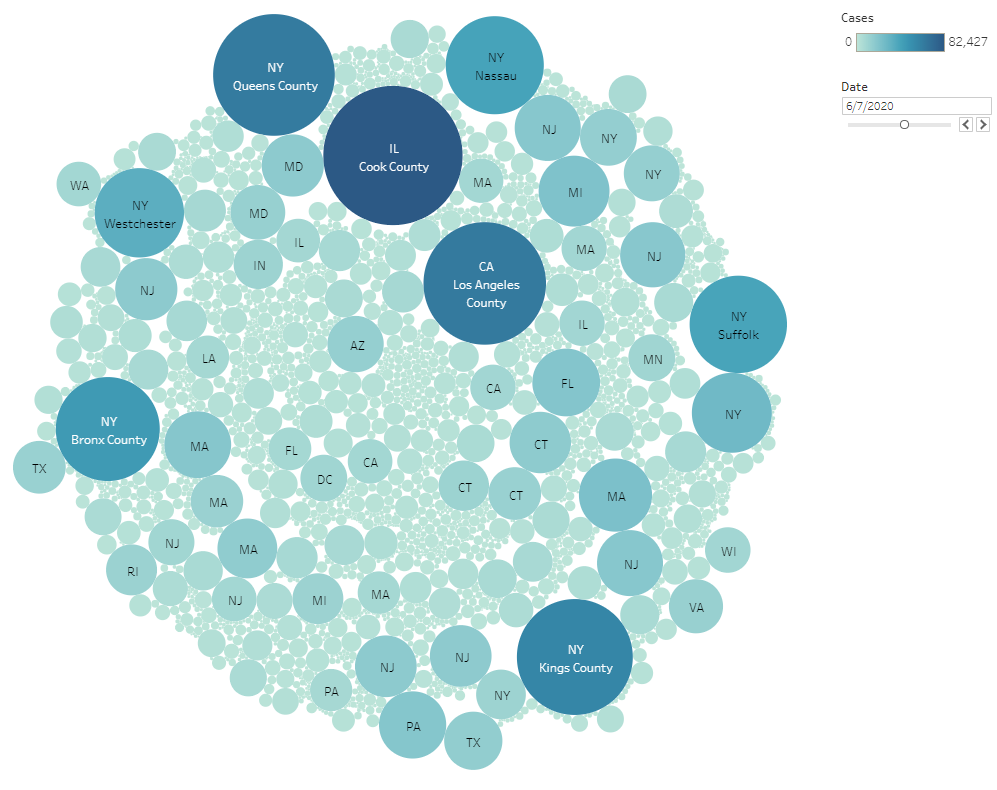
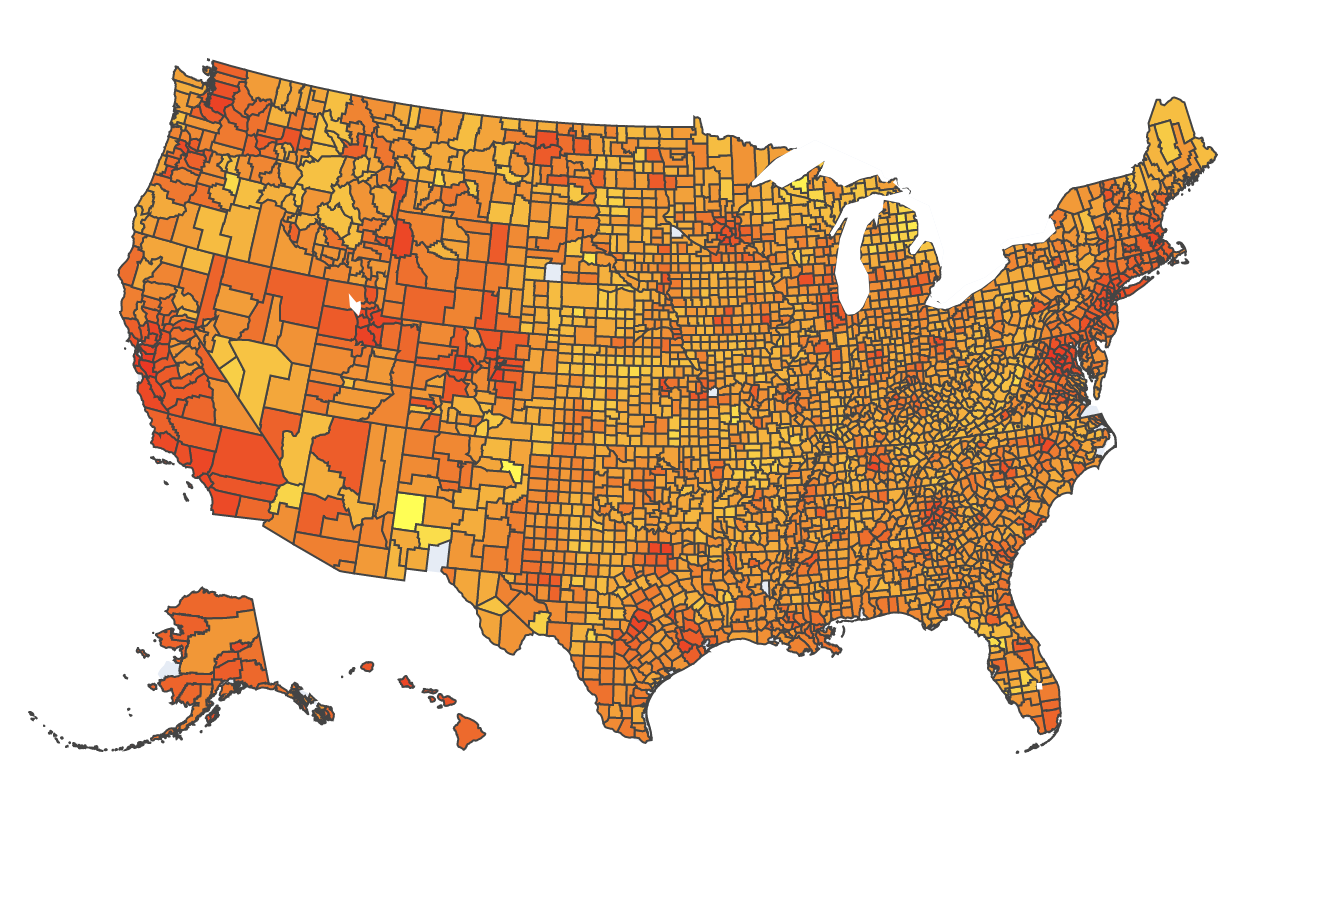
USA Cases and Deaths by County
COVID-19 Cases and Deaths by County LIVE - Daily
Cases vs % Black per State
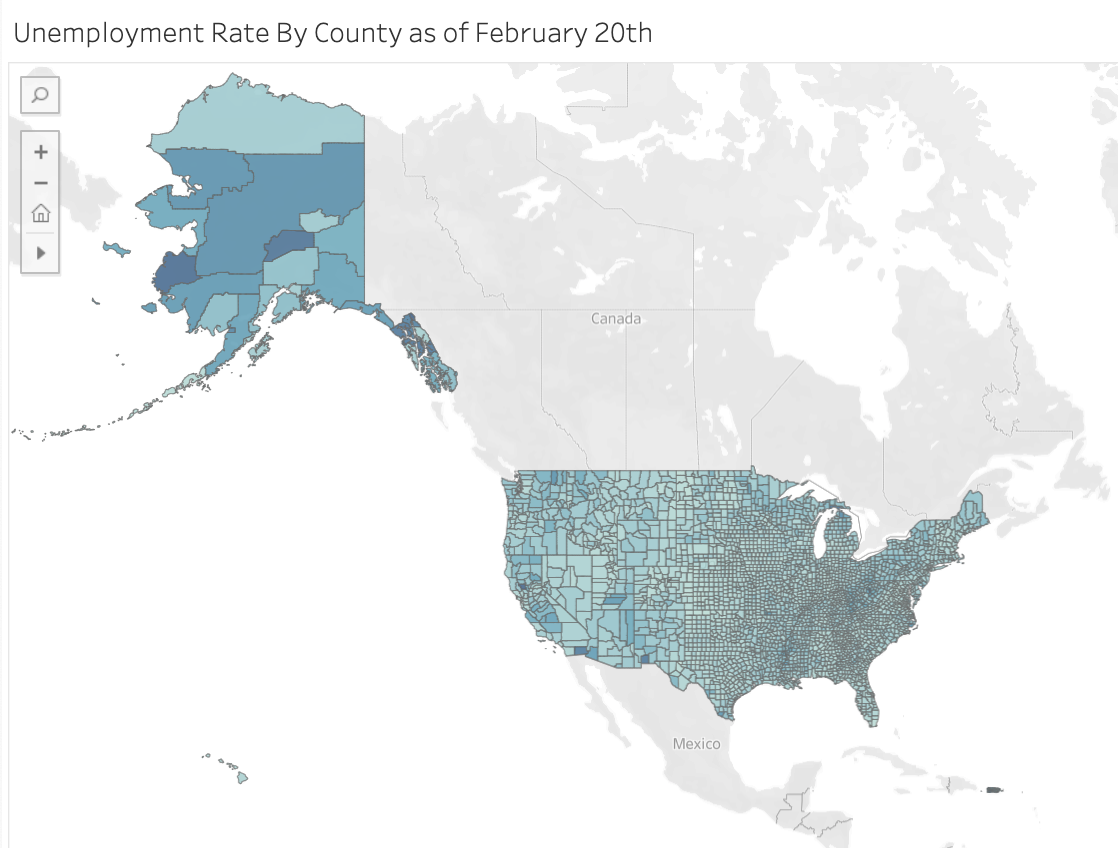
Unemployment Rate by County as of February 20th
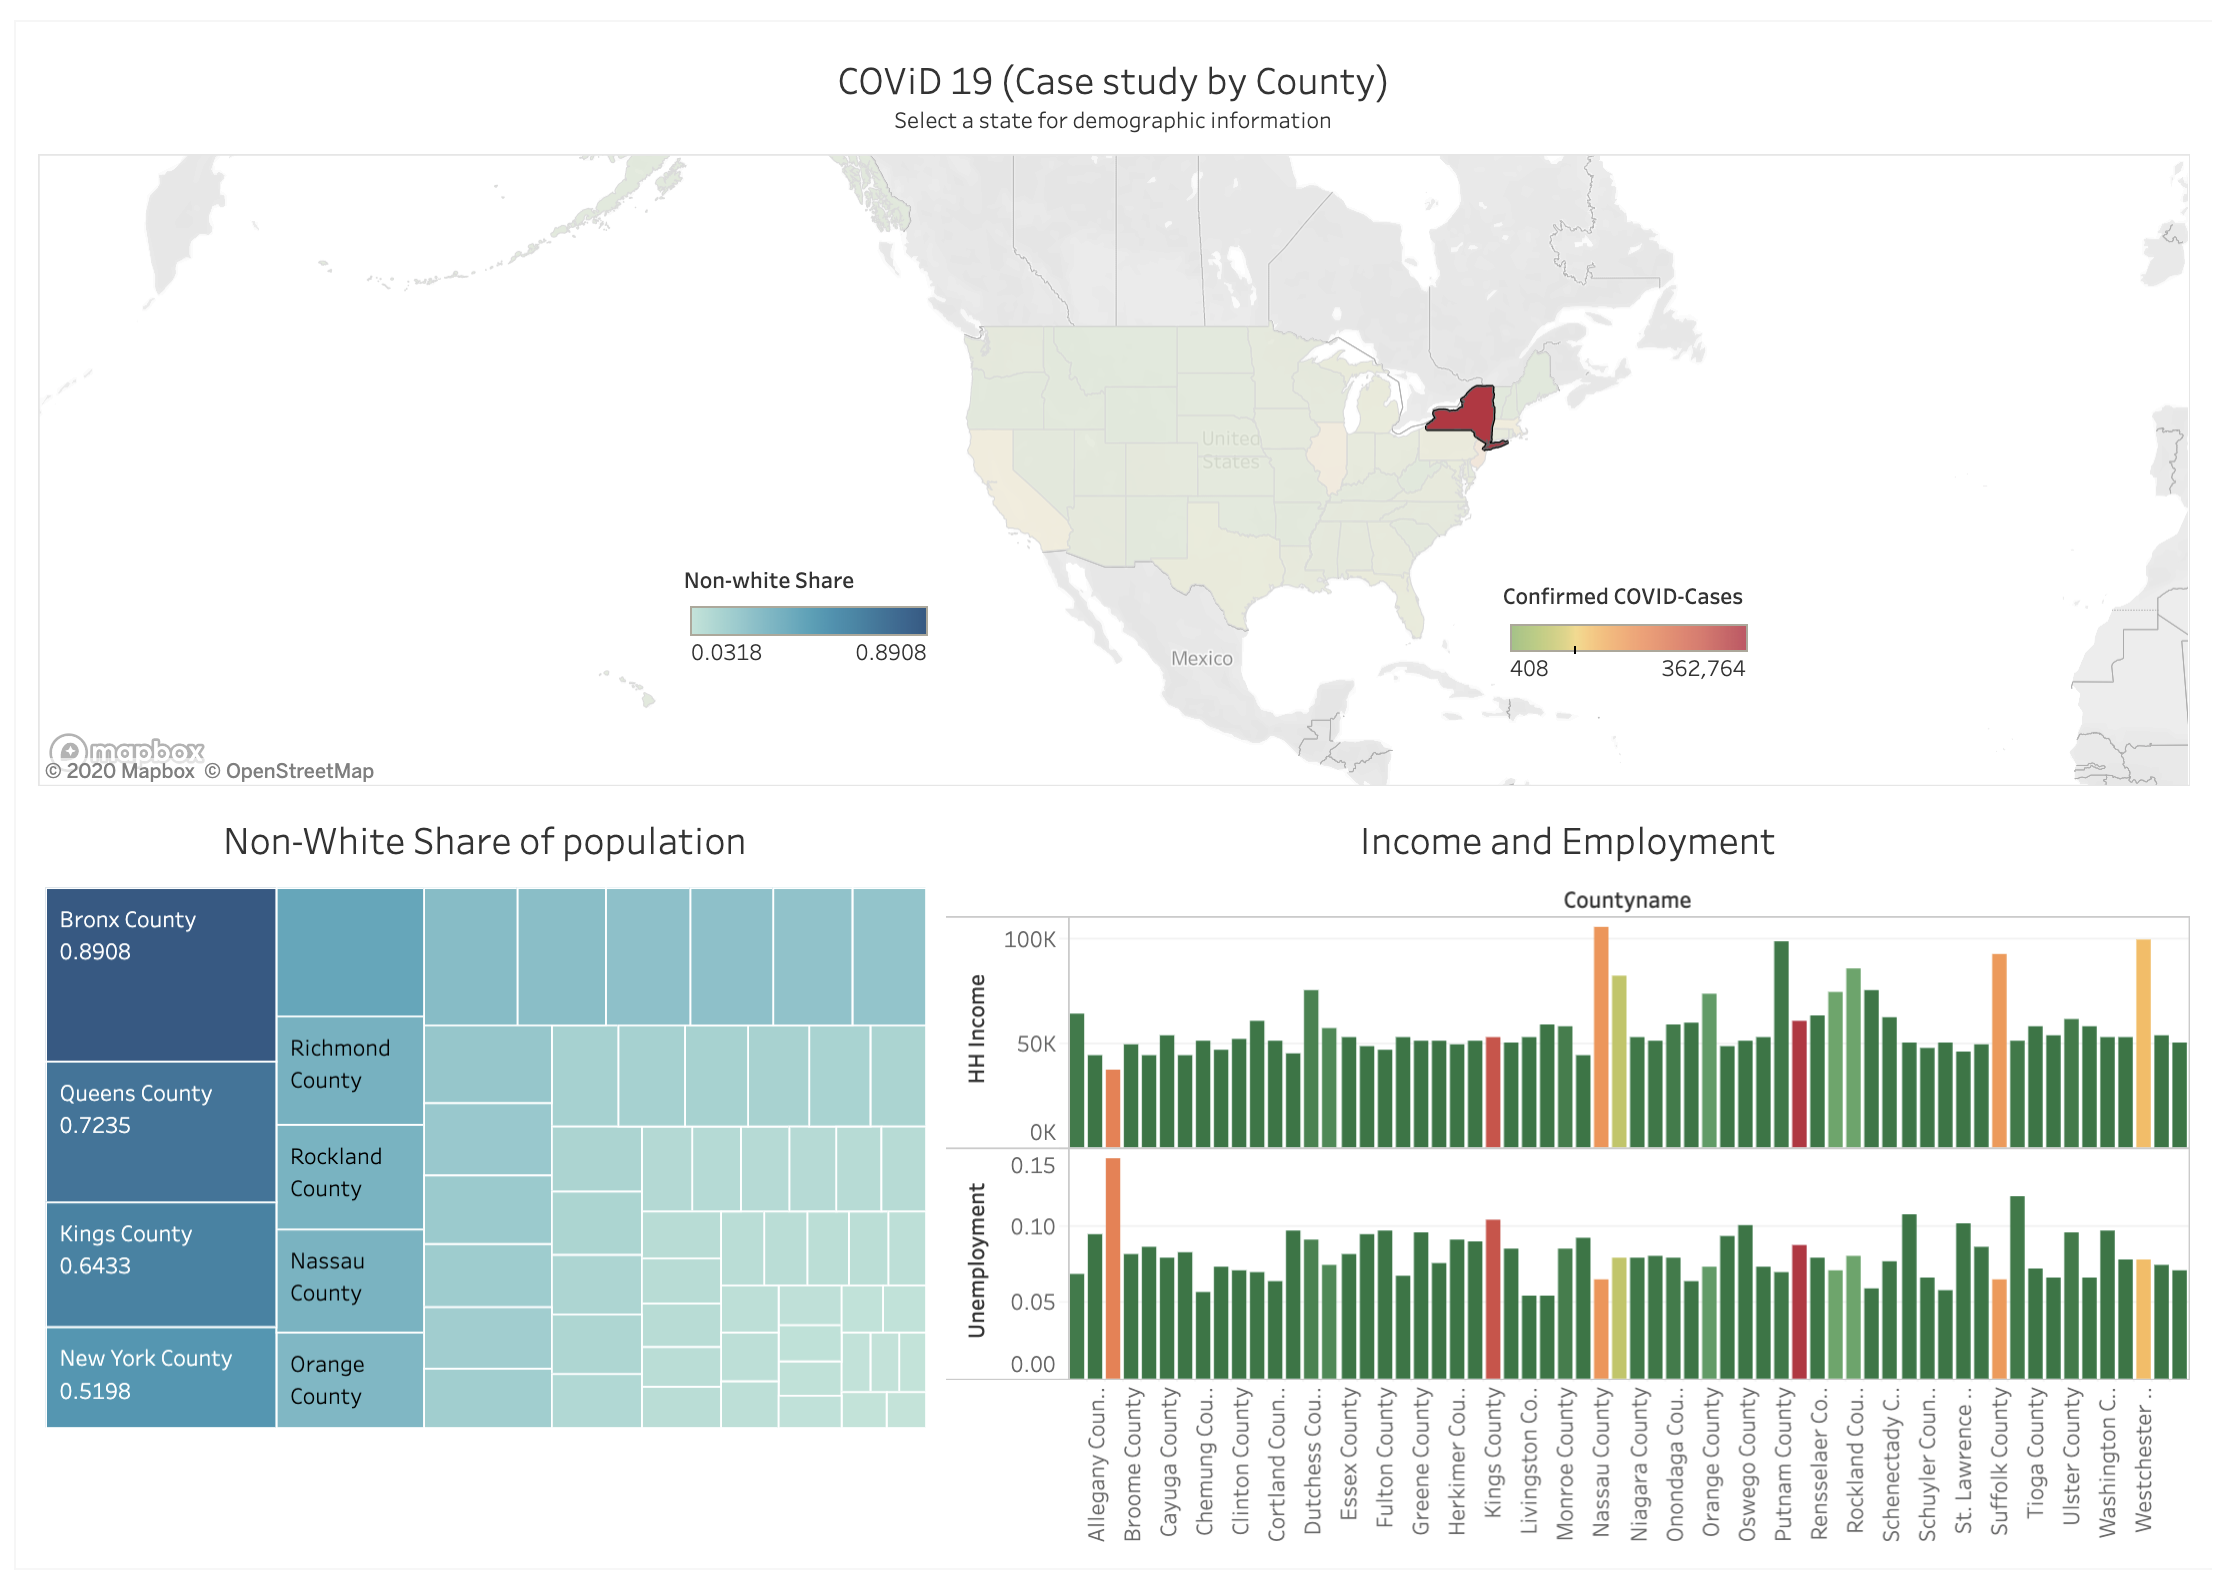
COVID-19 Case Study by County
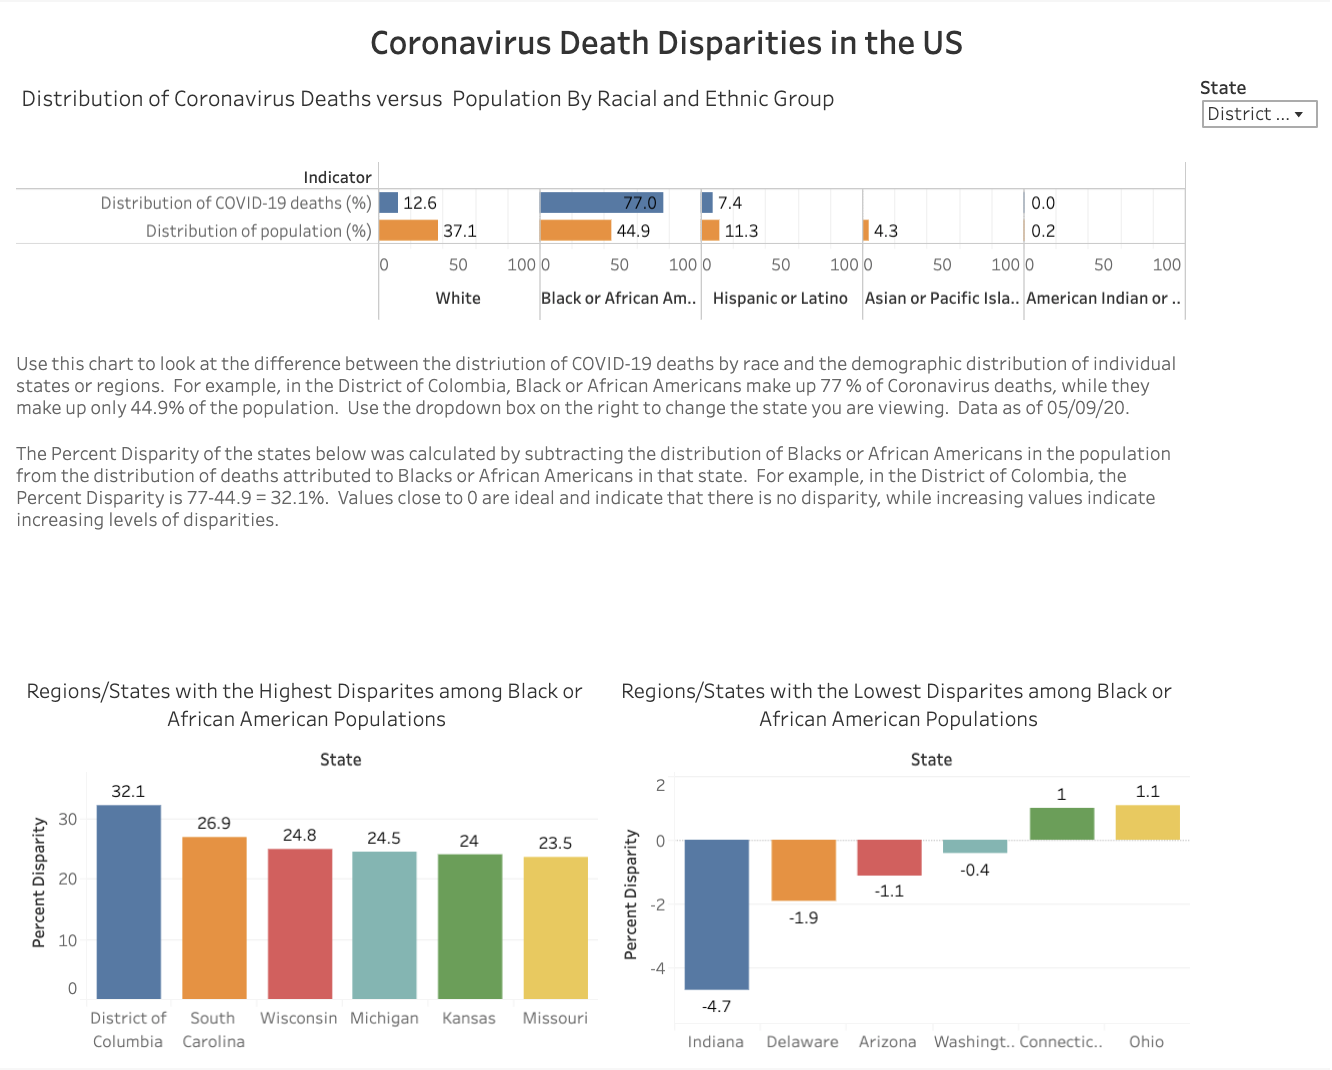
COVID-19 Death Disparities
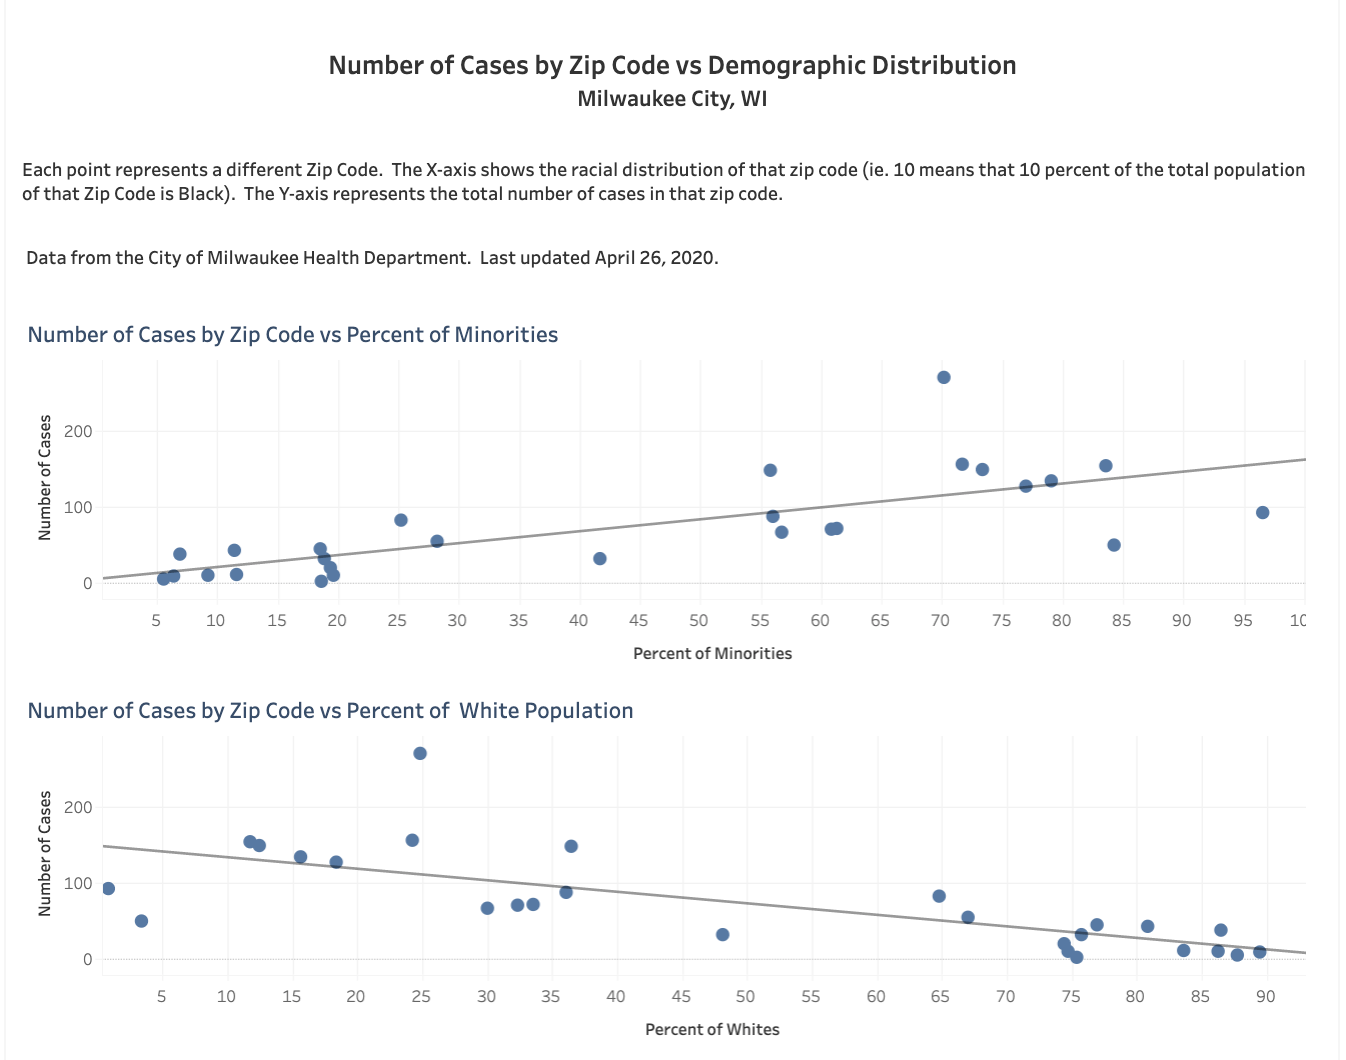
Number of Cases by Zip Code vs. Demographic Distribution
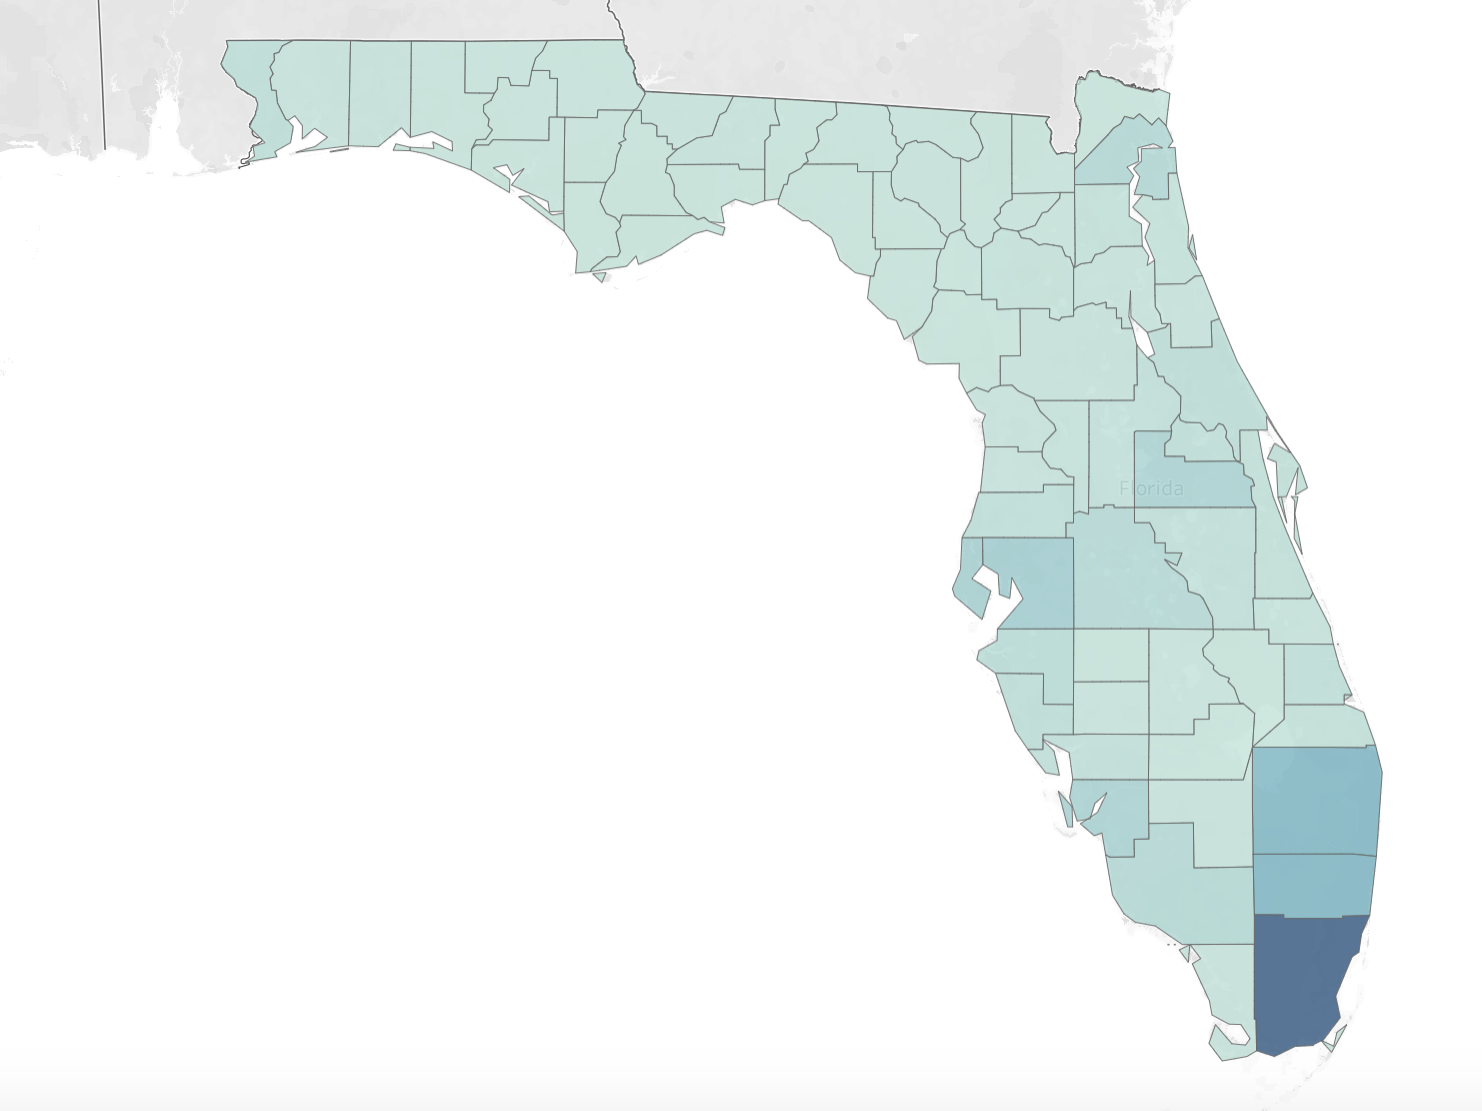
Case Spike in Florida
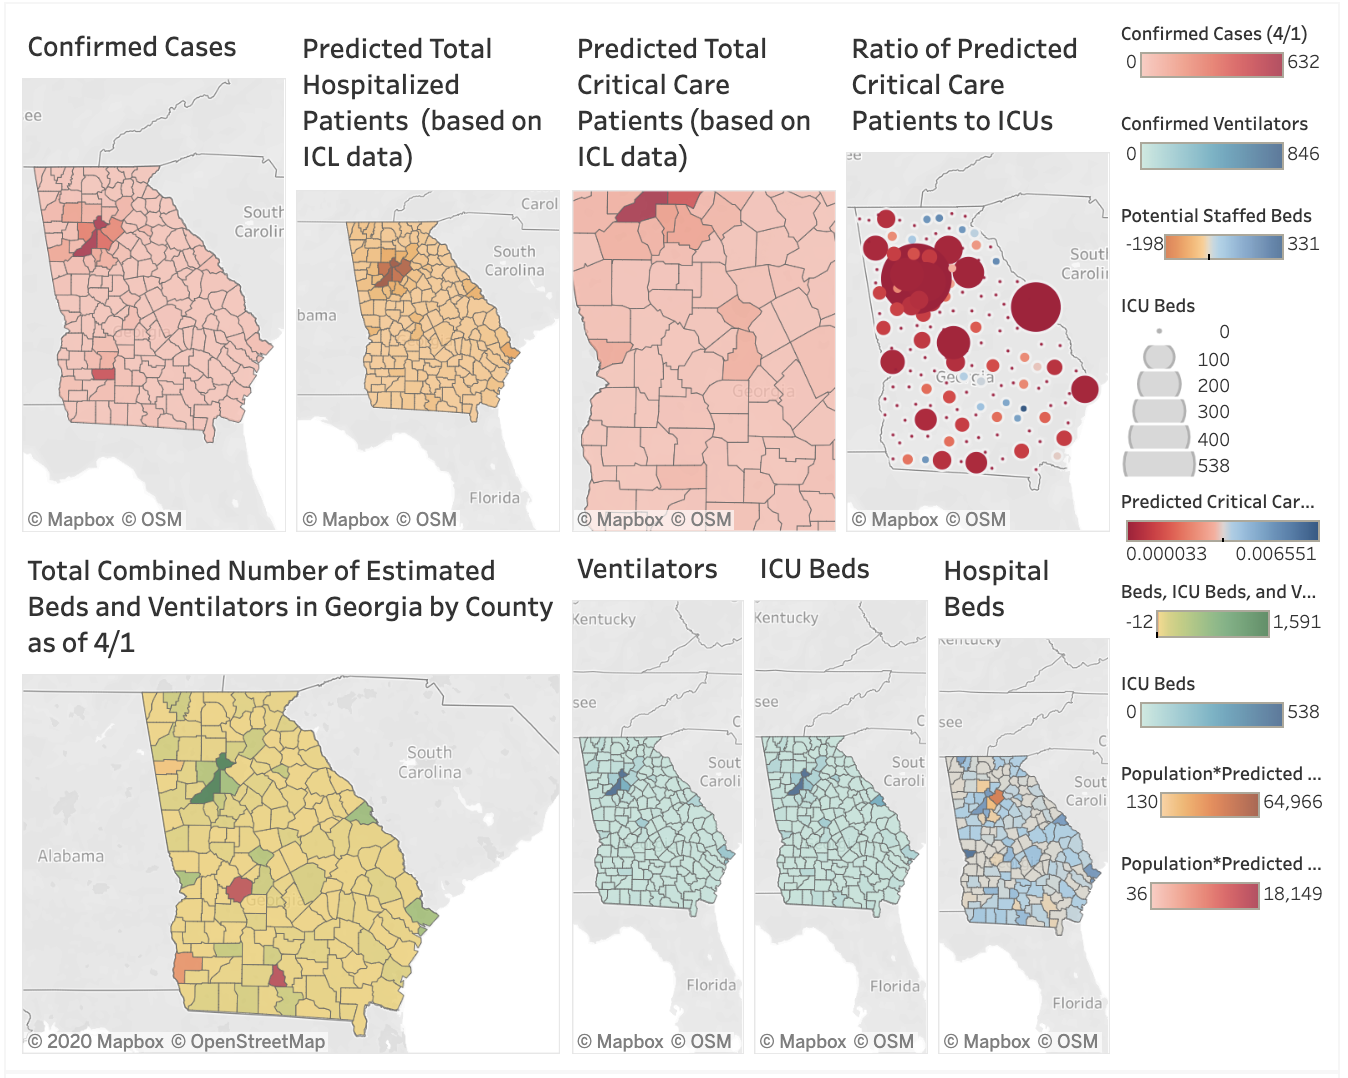
COVID-19 in Georgia
Live Infection Map
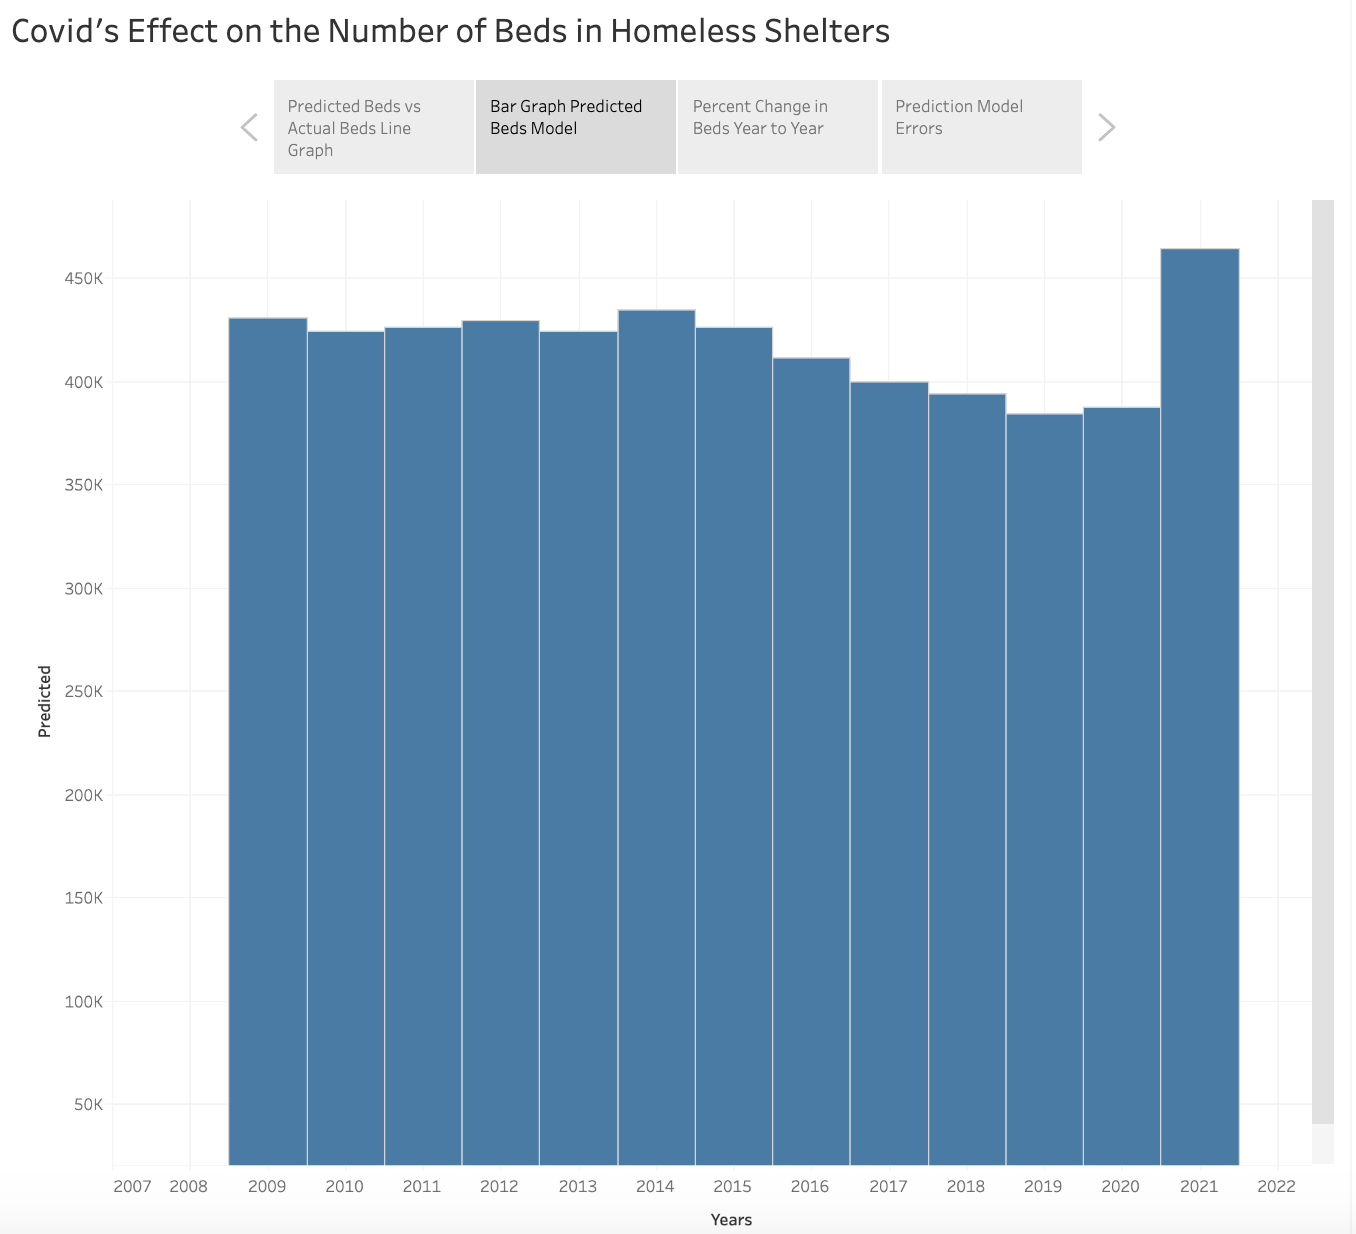
Covid's Effect on the Number of Beds in Homeless Shelters
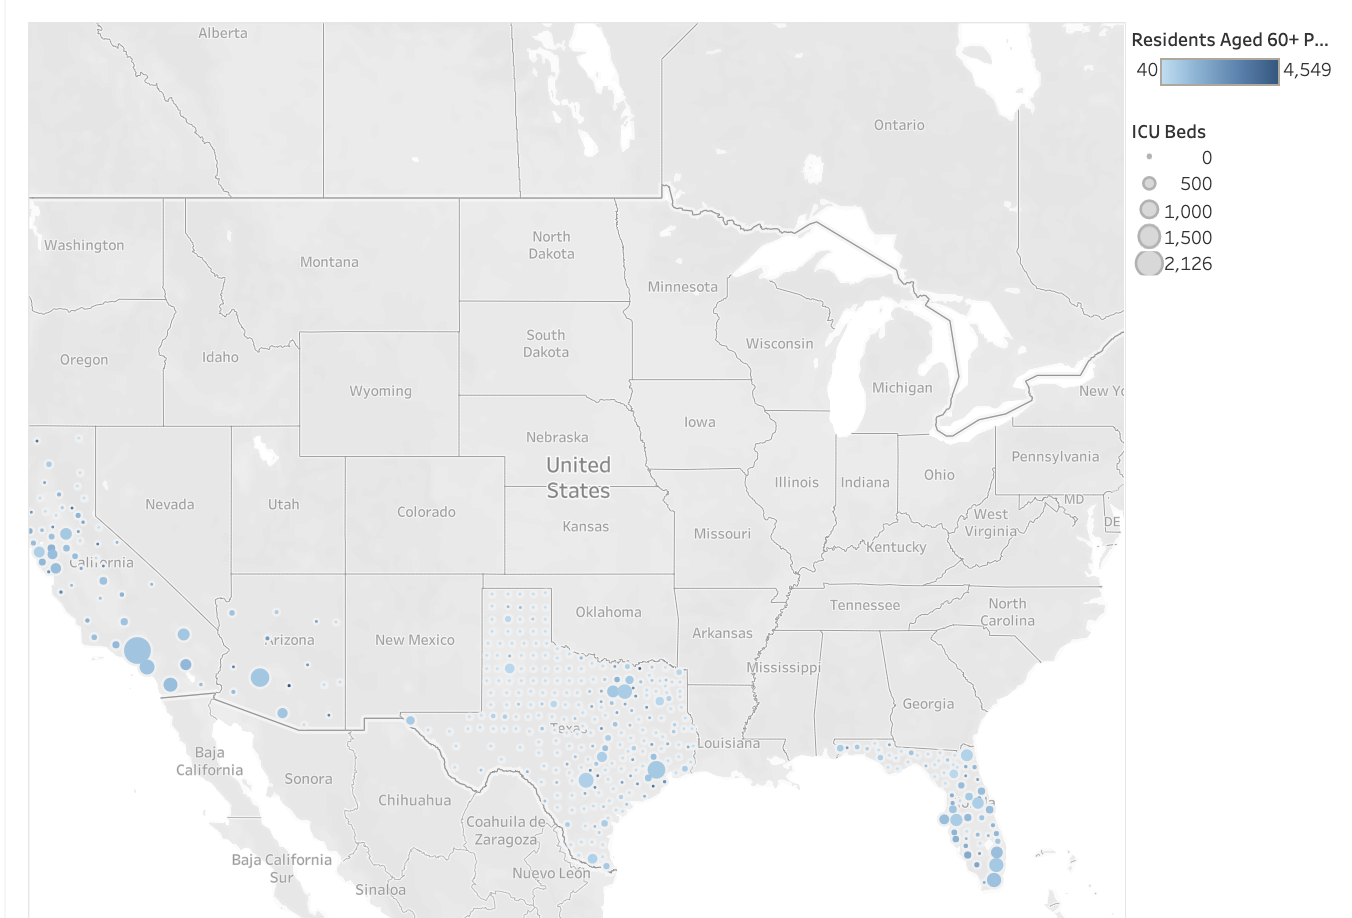
ICU Beds vs Residents Aged 60+ for each ICU Bed
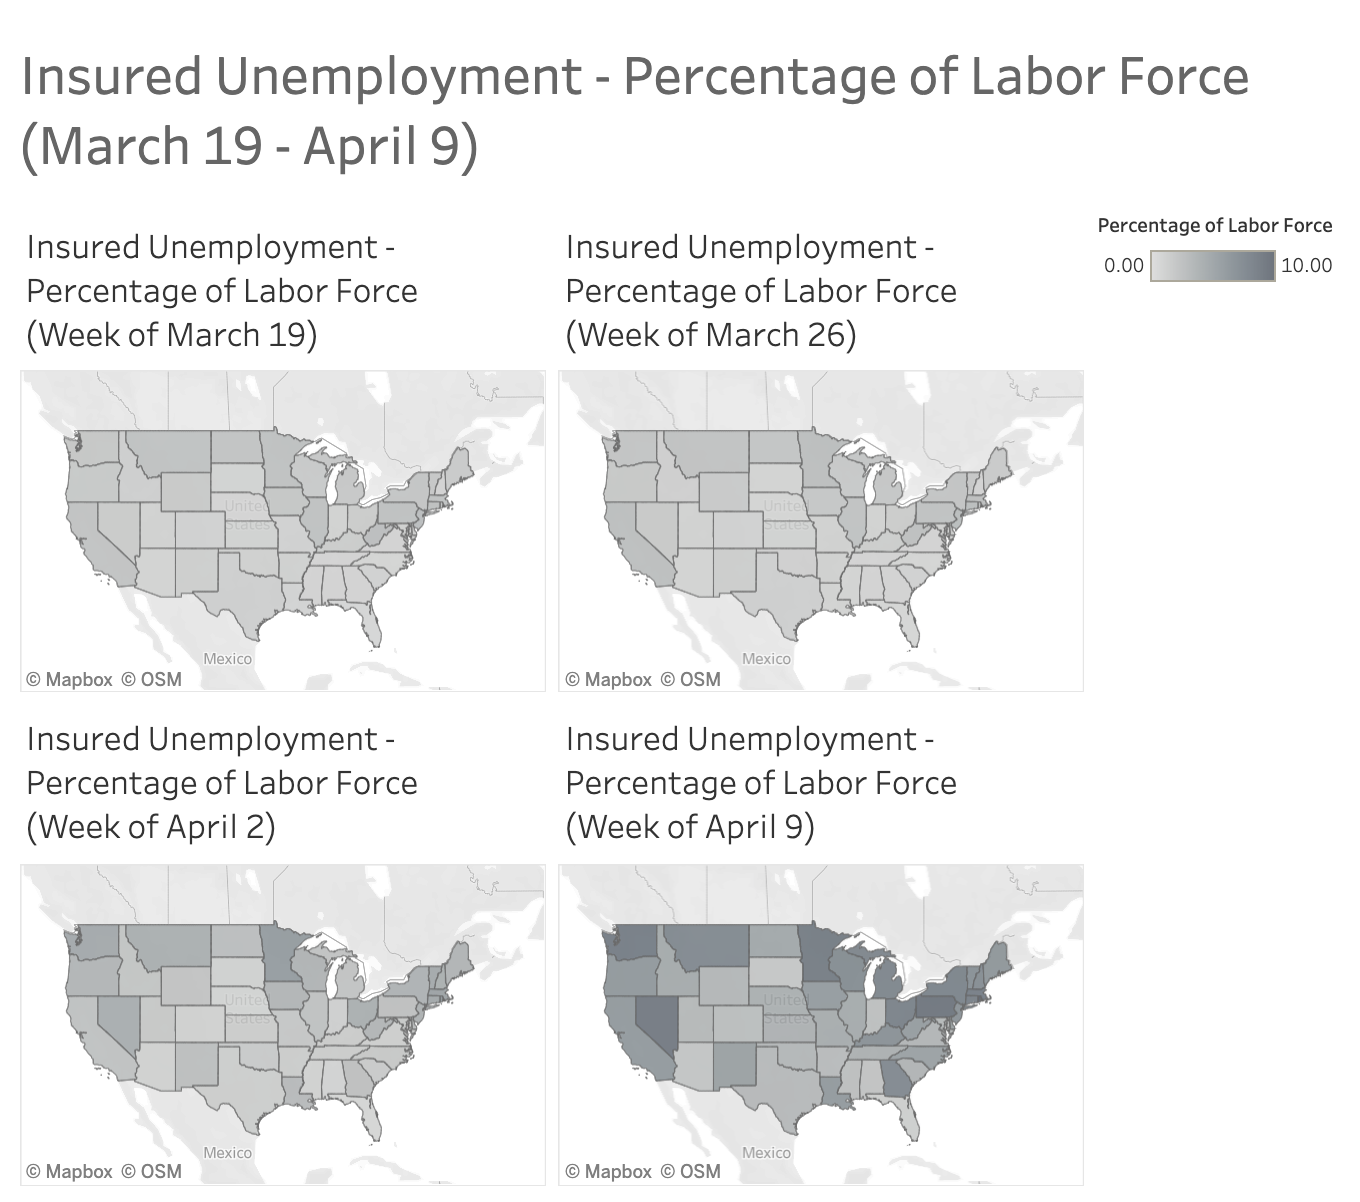
Insured Unemployment - Percentage of Labor Force (March 19 - April 9)
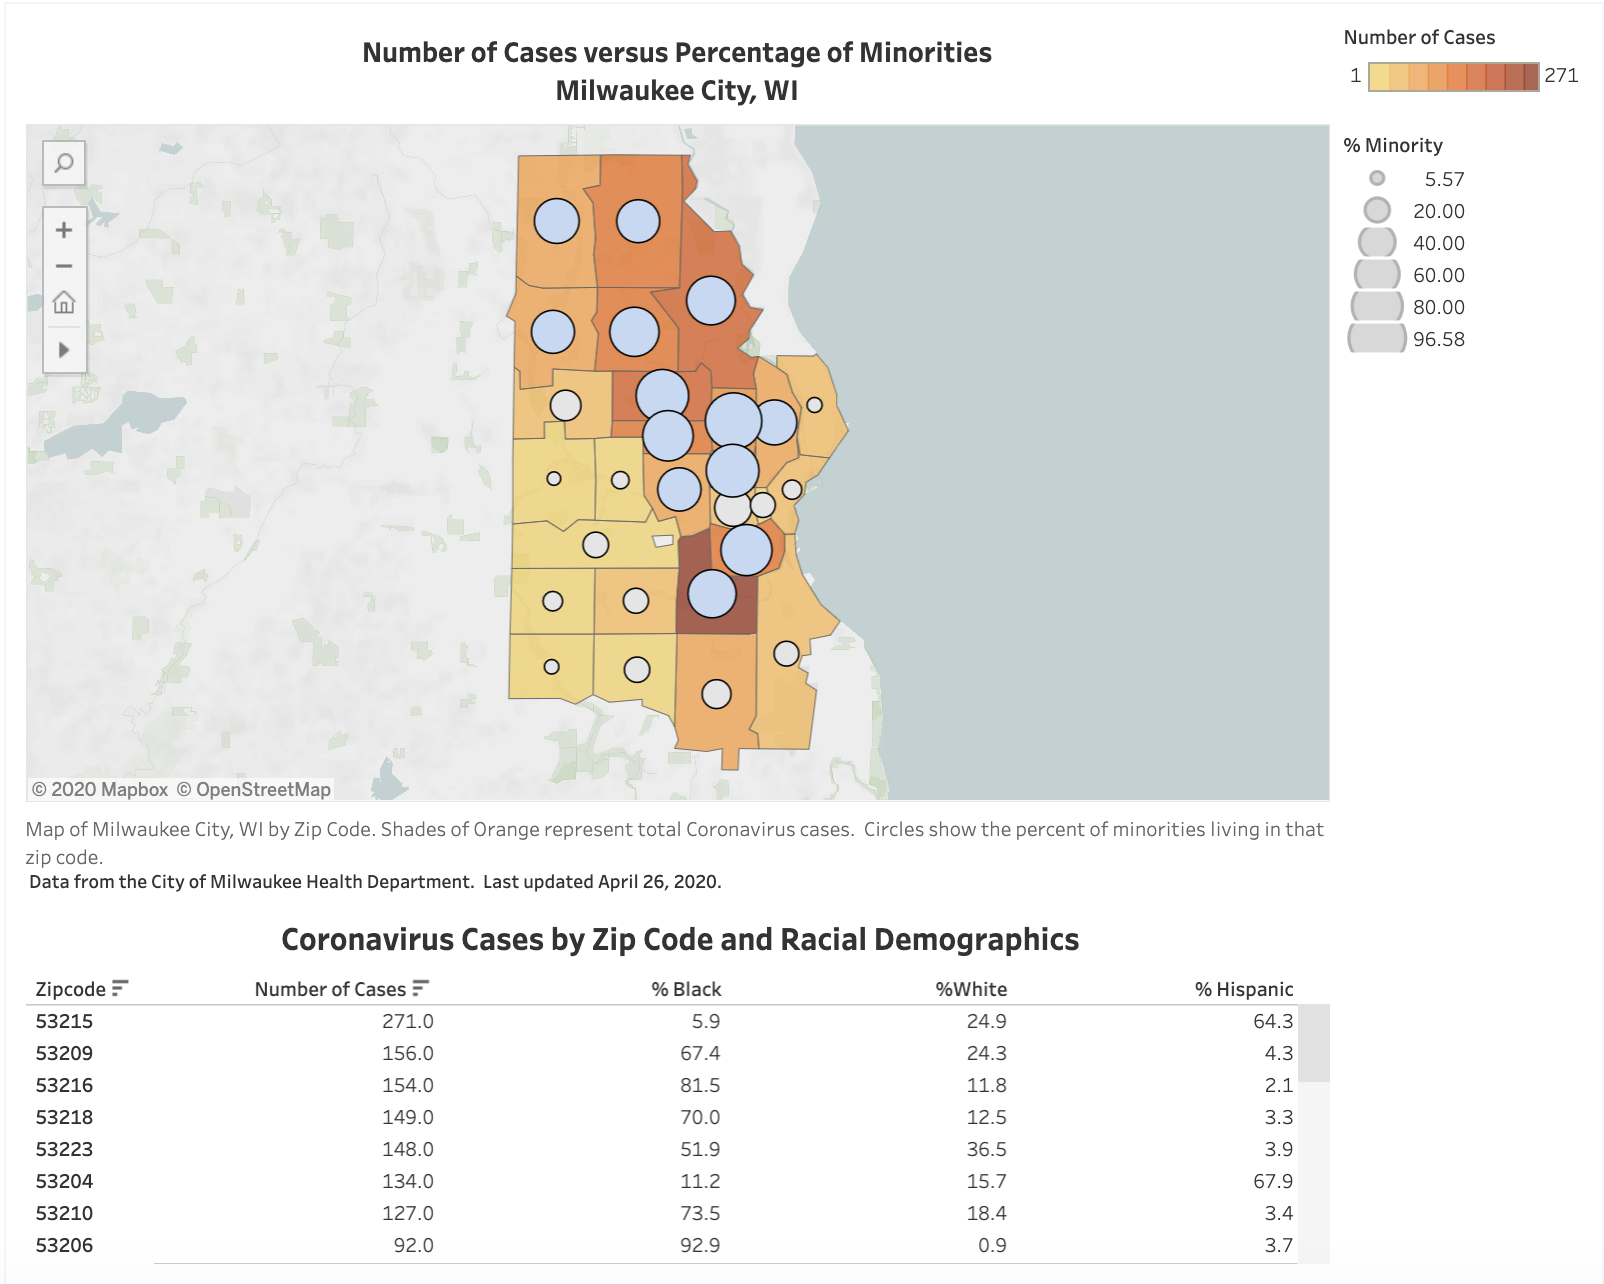
Number of Cases vs. Percentage of Minorities Milwaukee City, WI
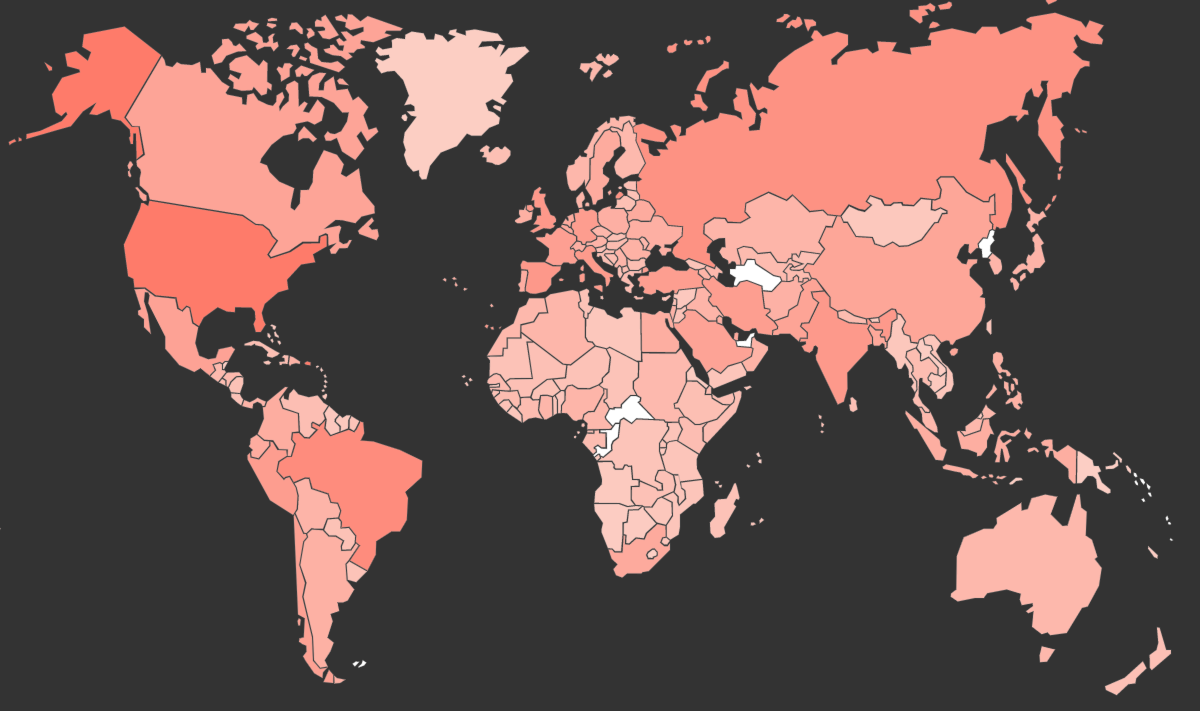
Mobility Trends on a Global Scale
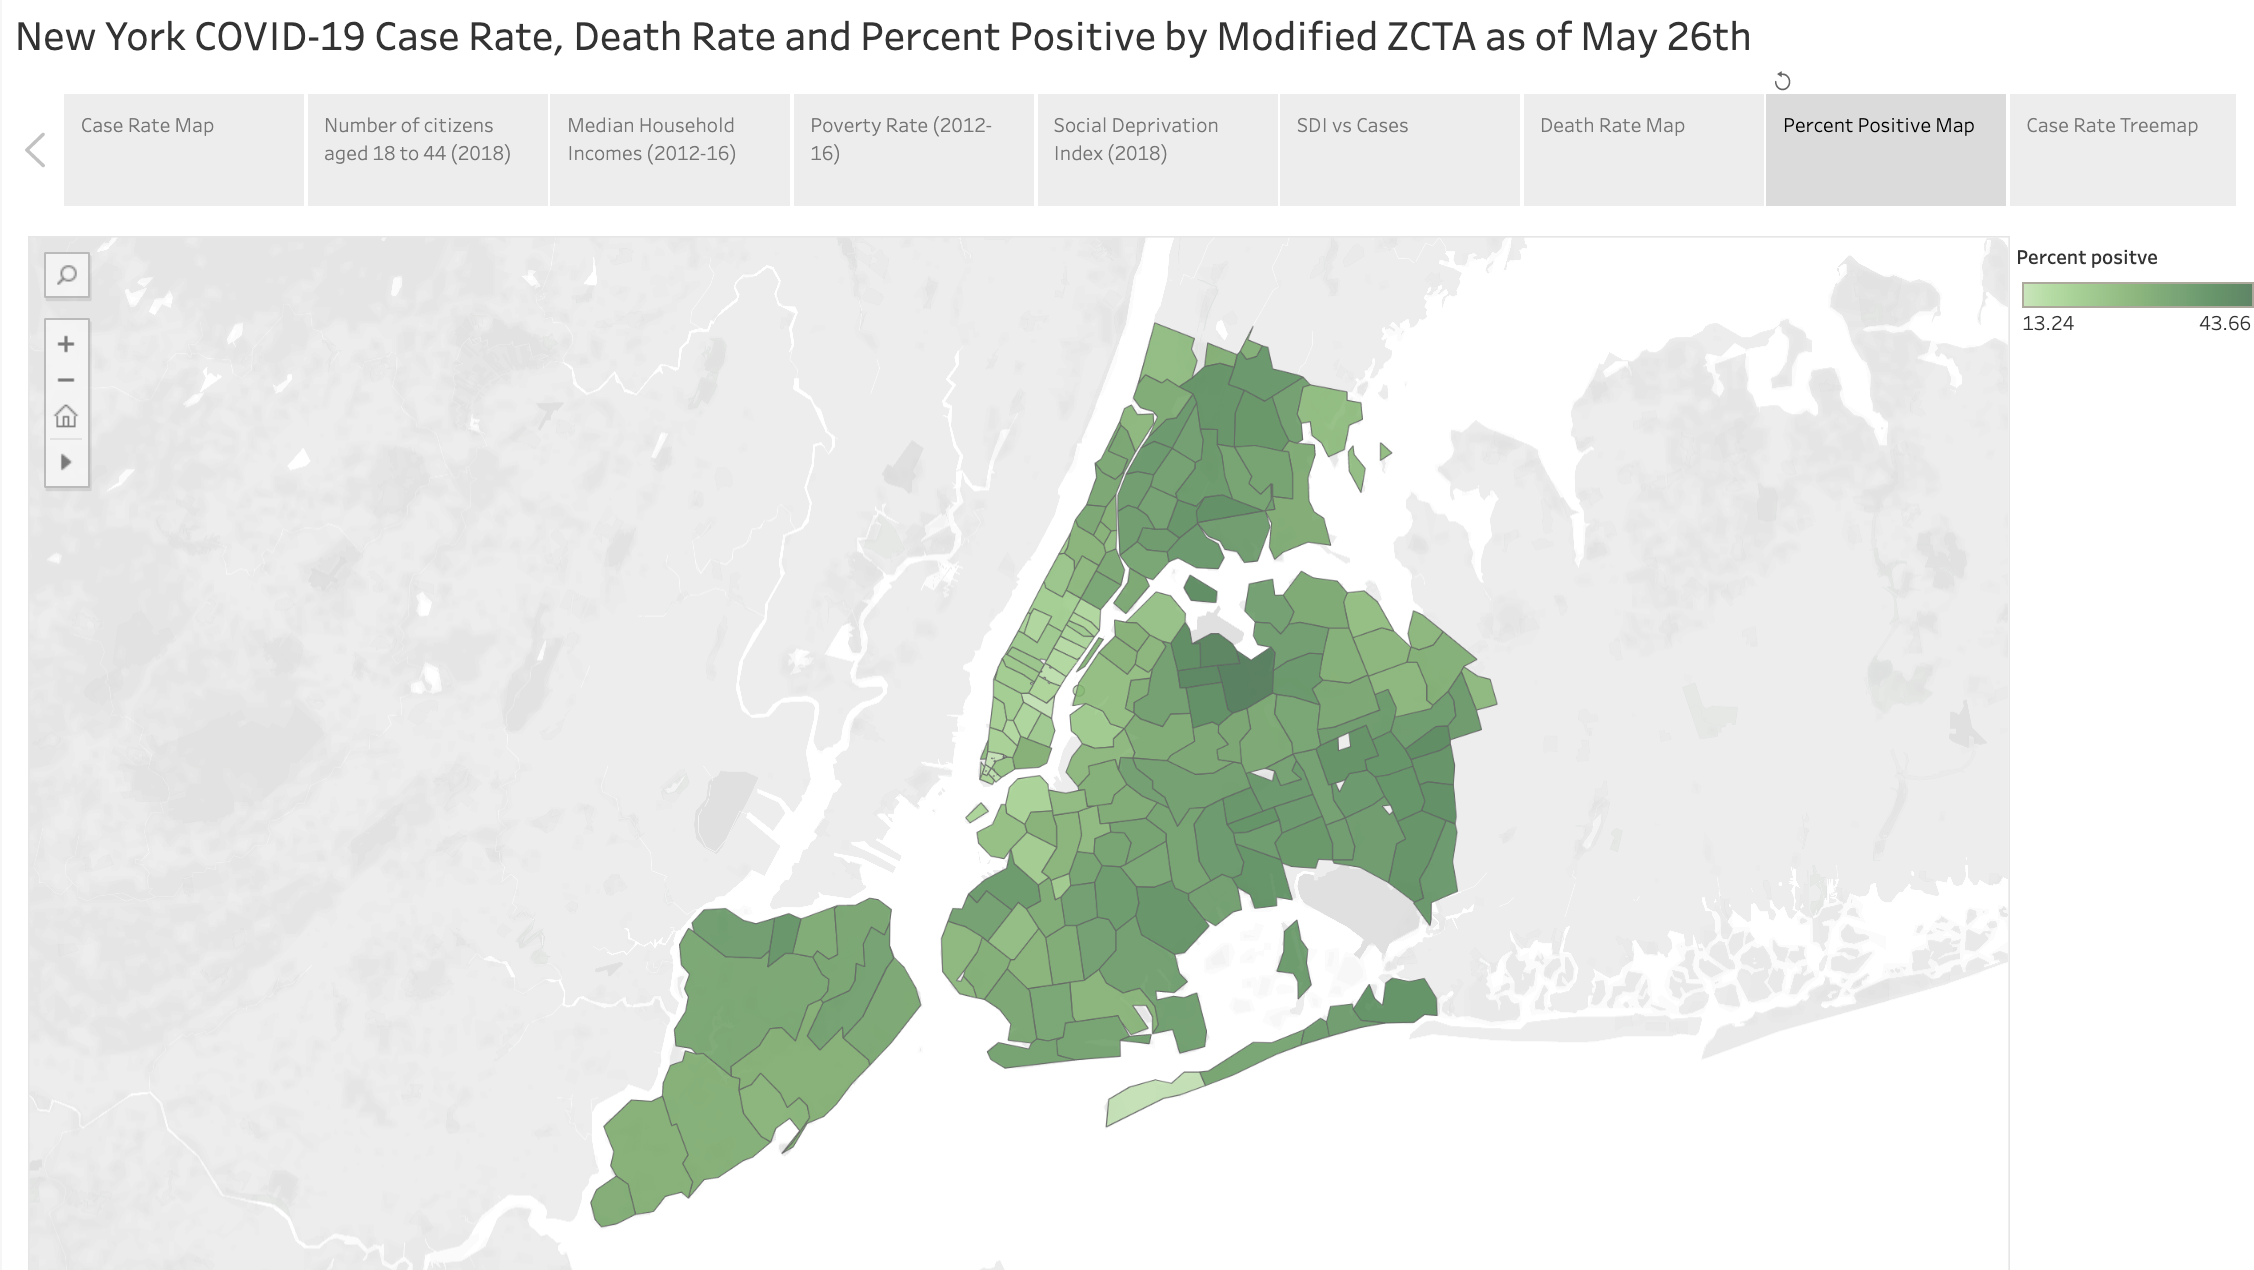
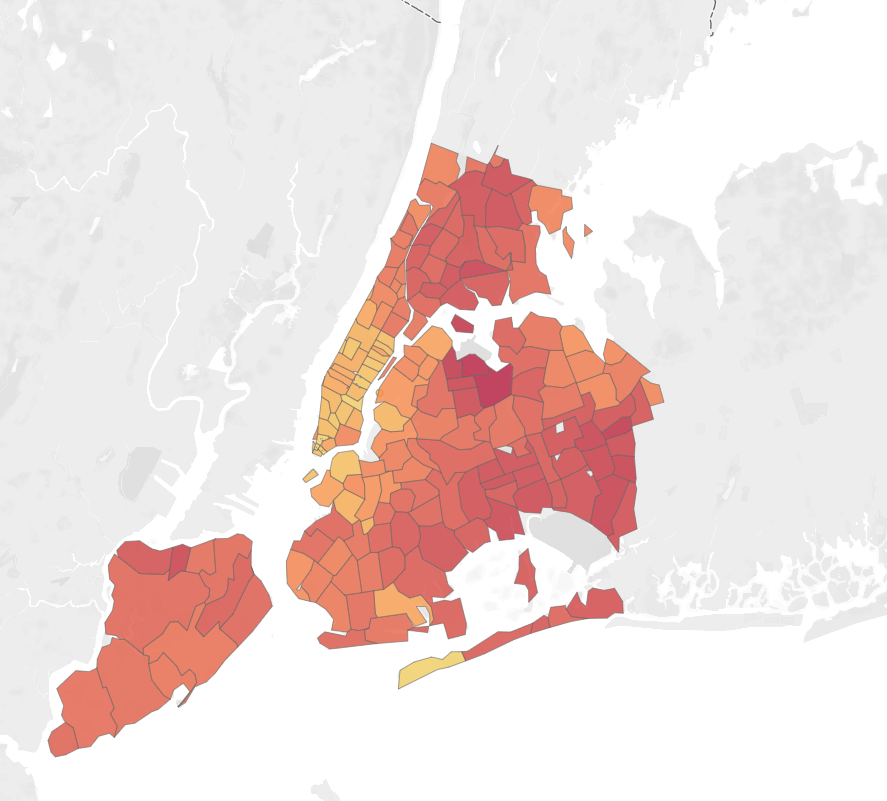
NYC COVID-19 Cases & Deaths by ZIP | Incomes, Poverty, & Age by Census Tract (May 21st)
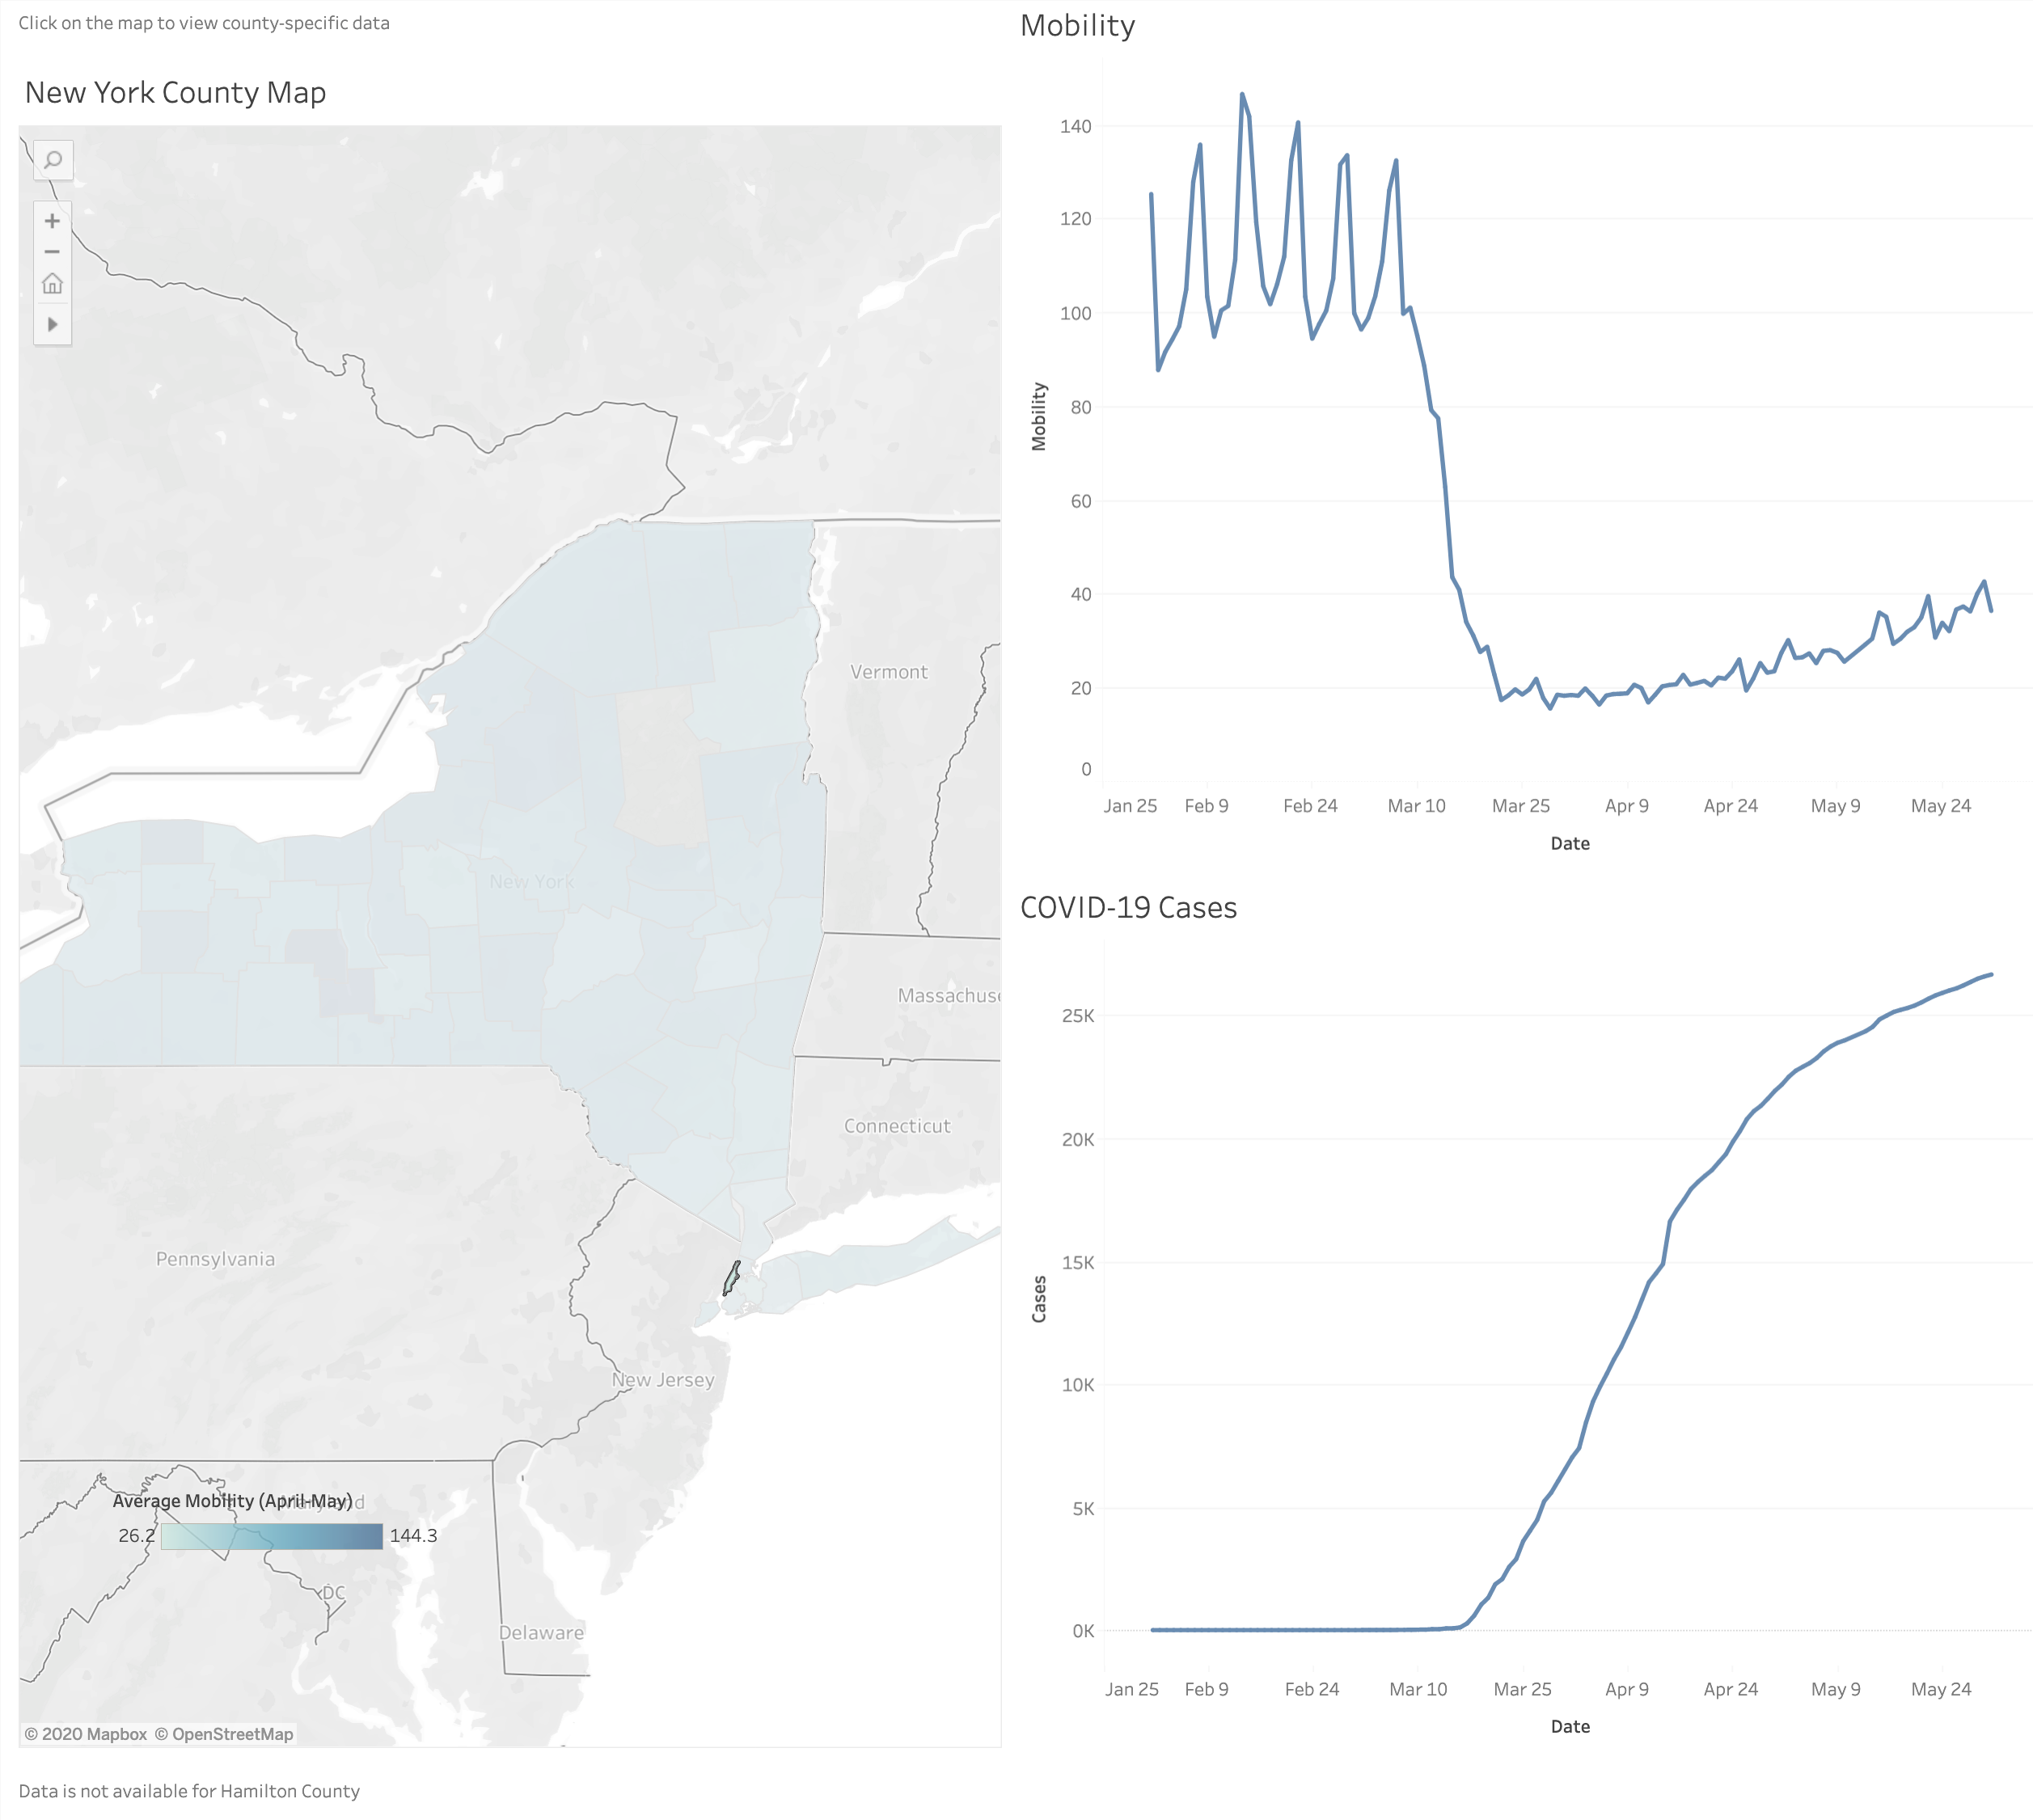
New York Mobility and Cases by County
NYC Cumulative Positive Tests Per 1000 People (Live Update - Daily)
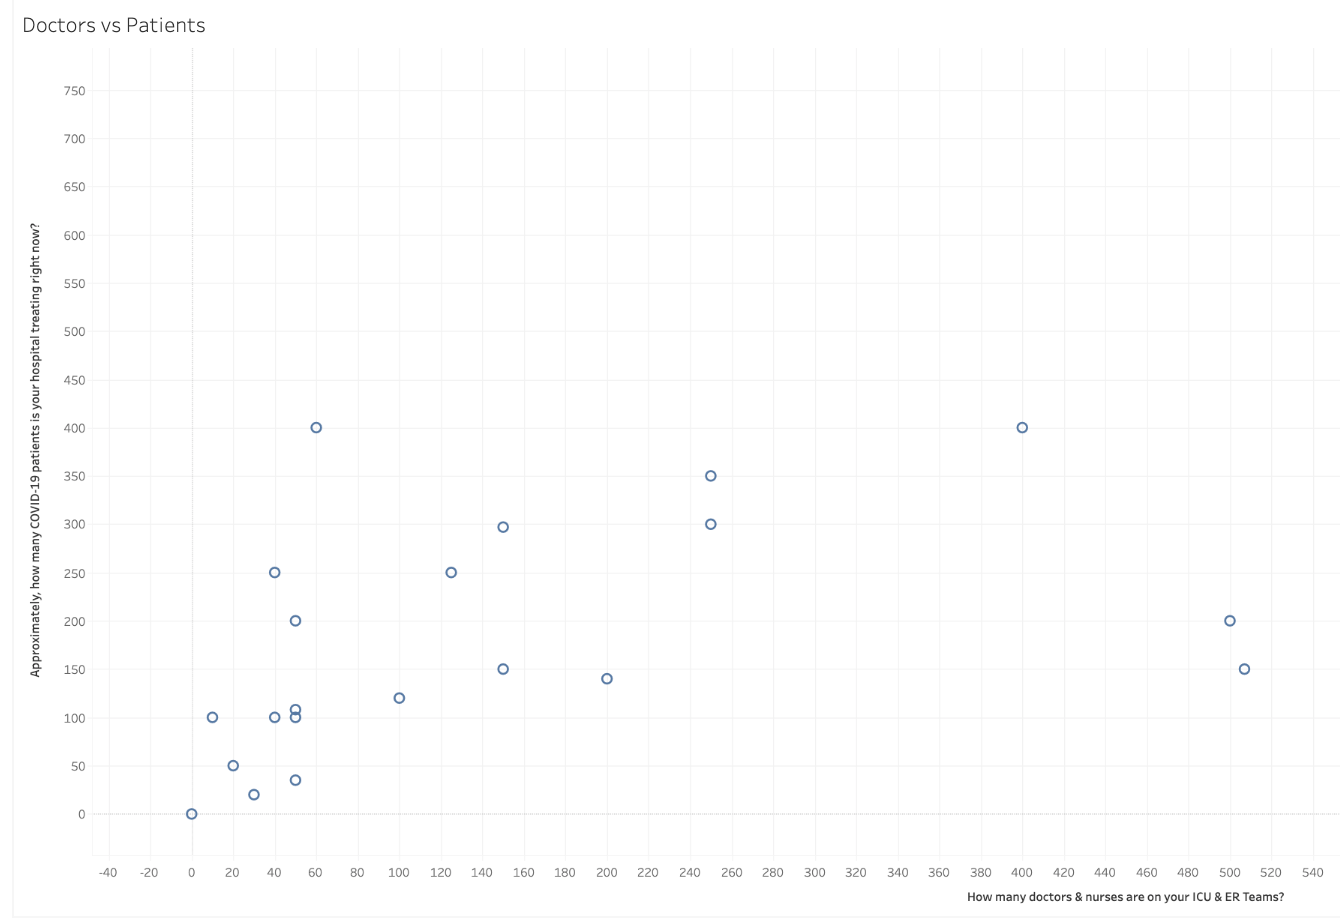
NYC Doctors vs. Patients
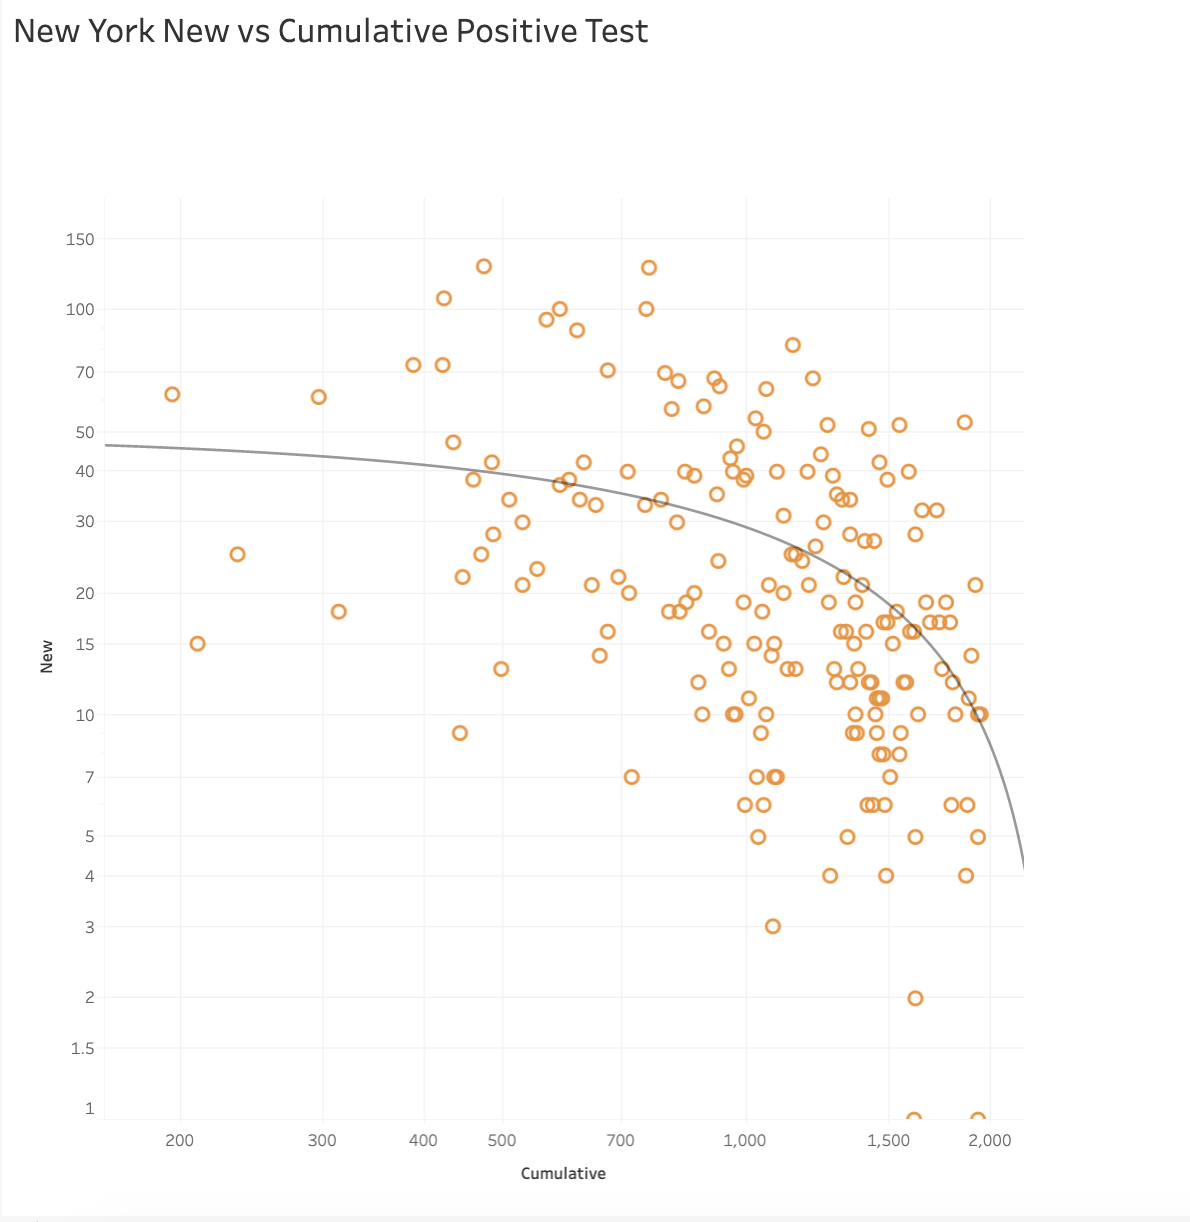
New York New vs. Cumulative Positive Tests
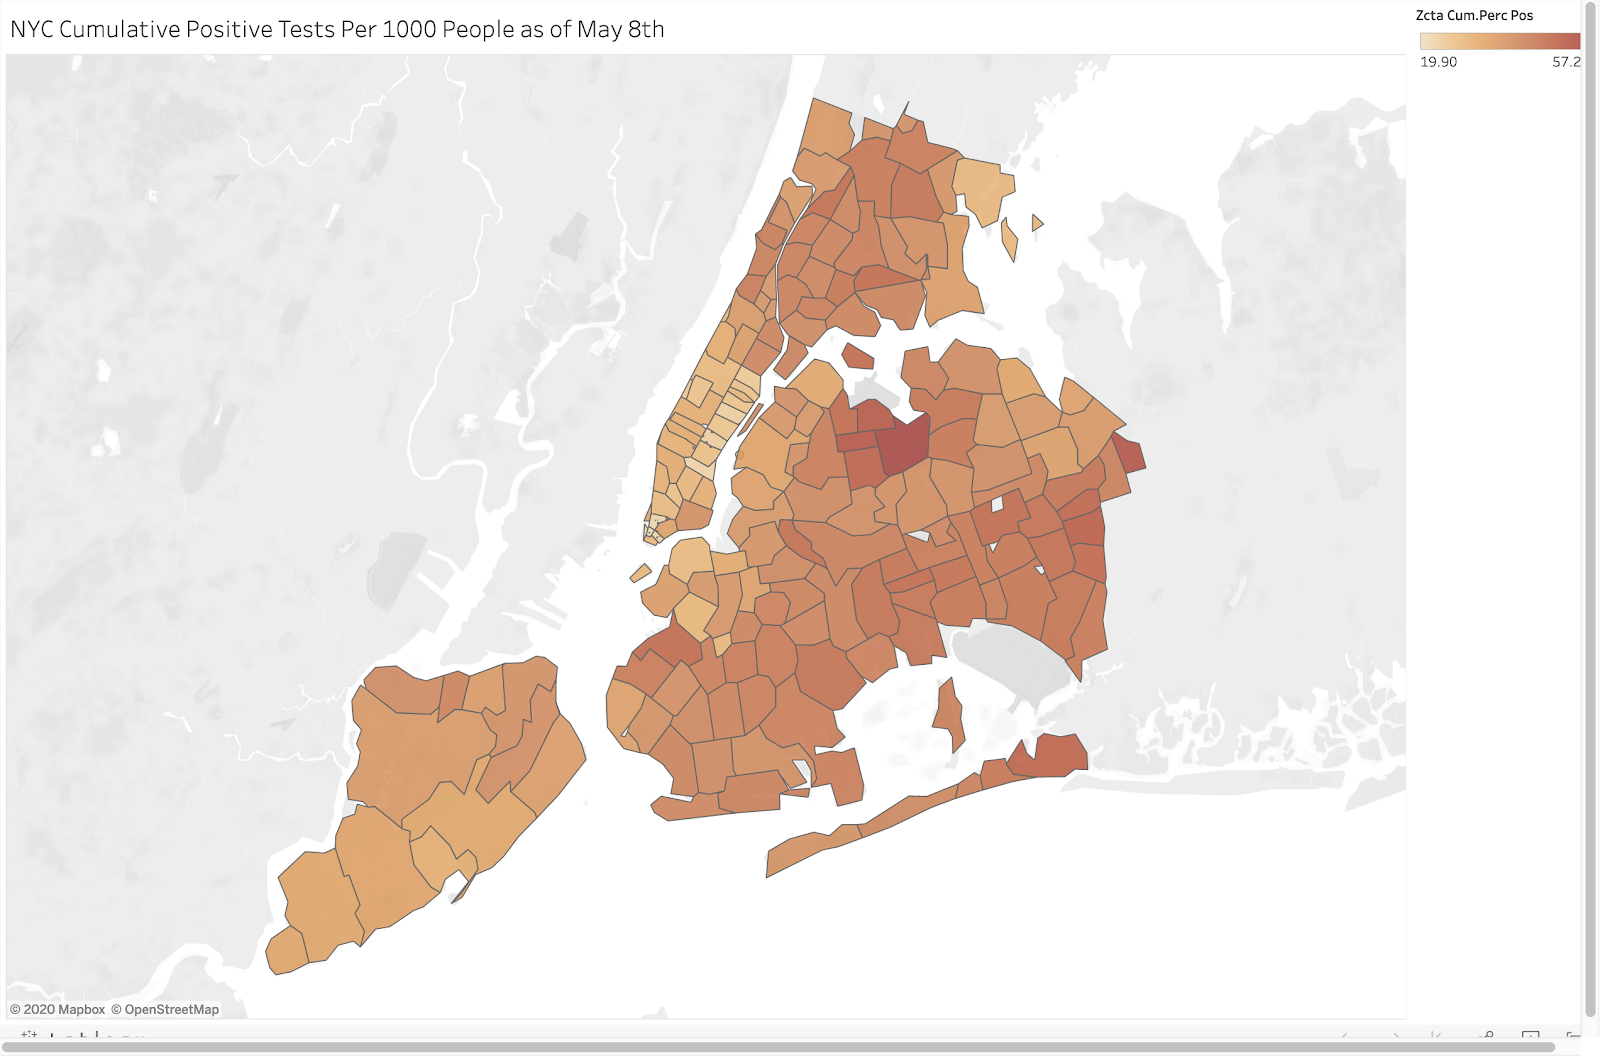
NYC Cumulative Positive Tests Per 1000 People as of May 8th
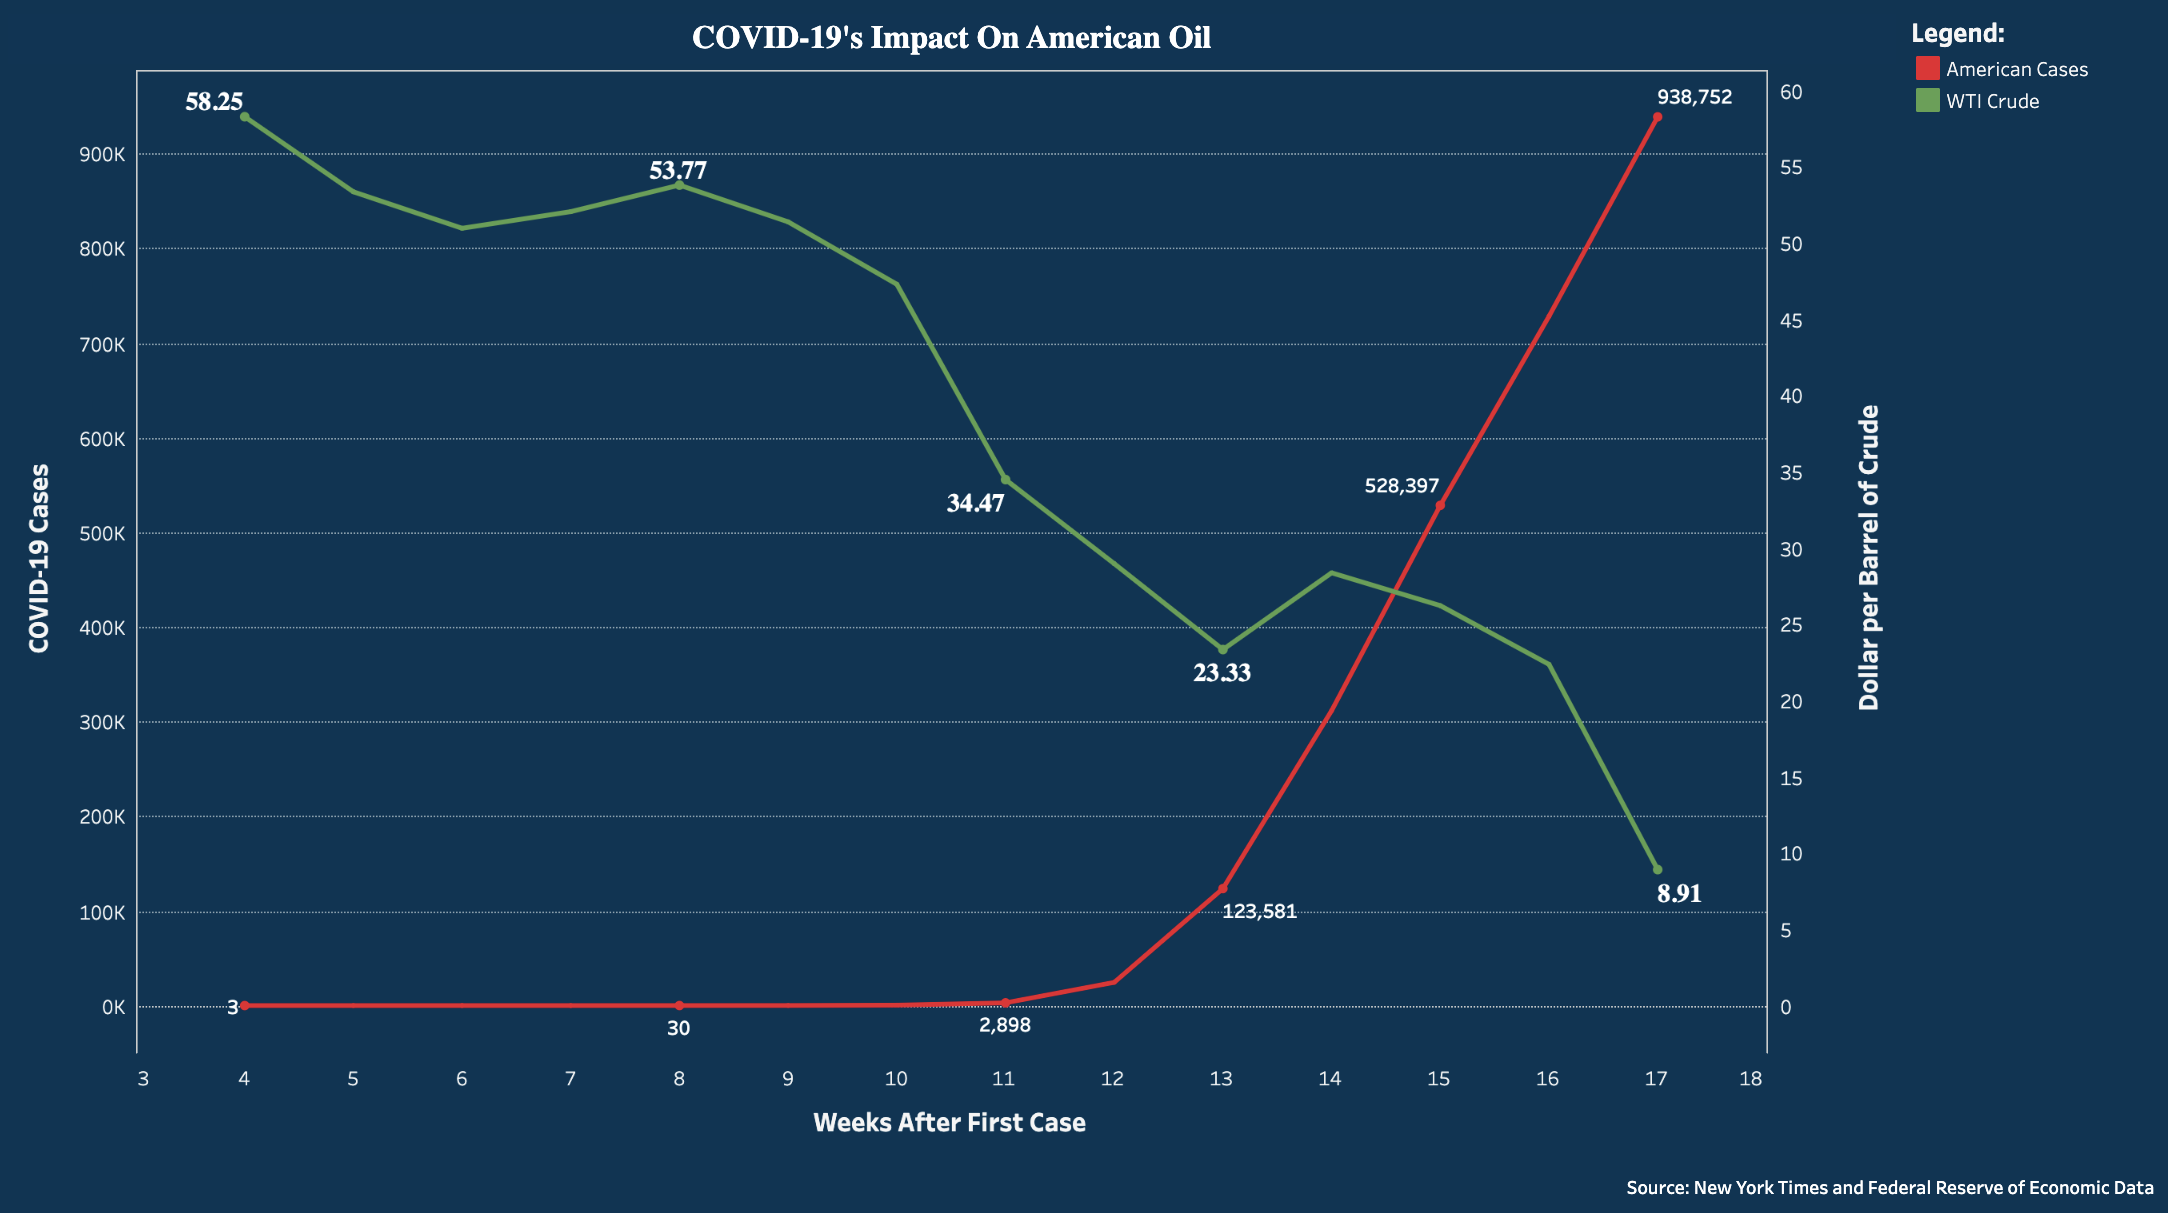
COVID-19's Impact on American Oil
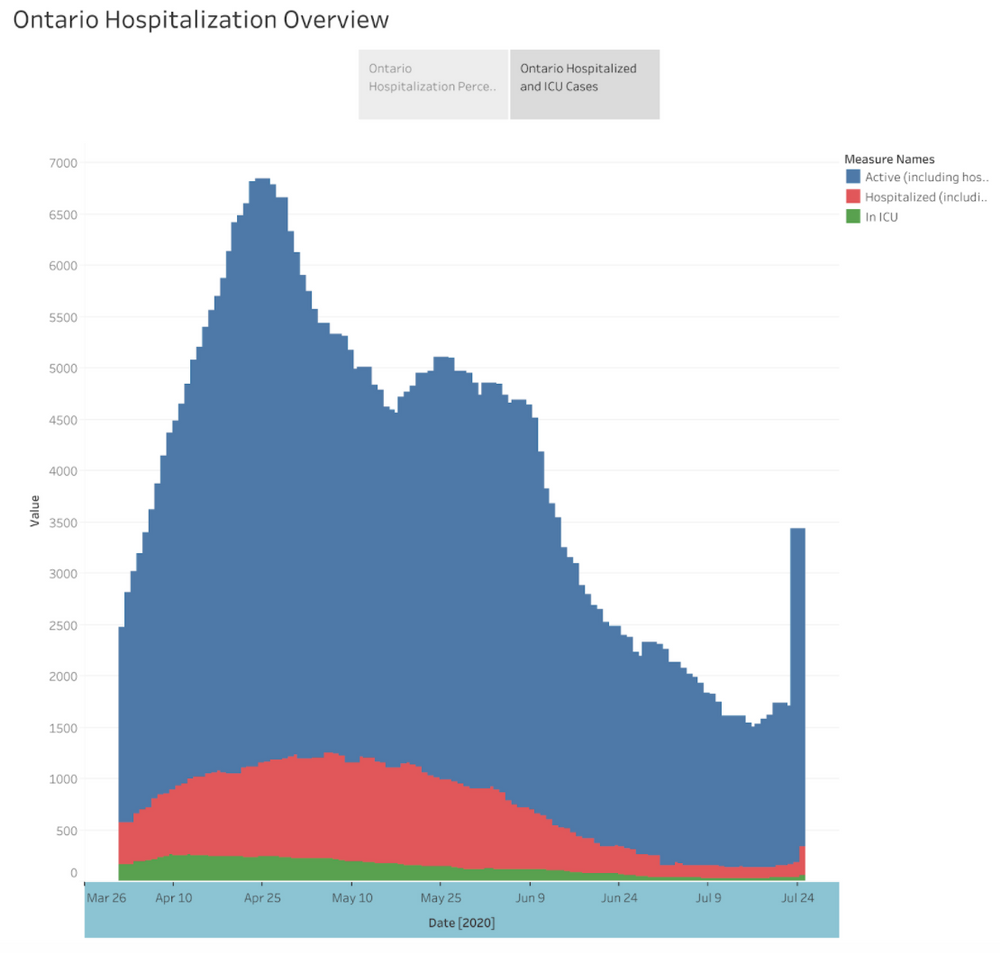
Ontario Hospitalization Overview
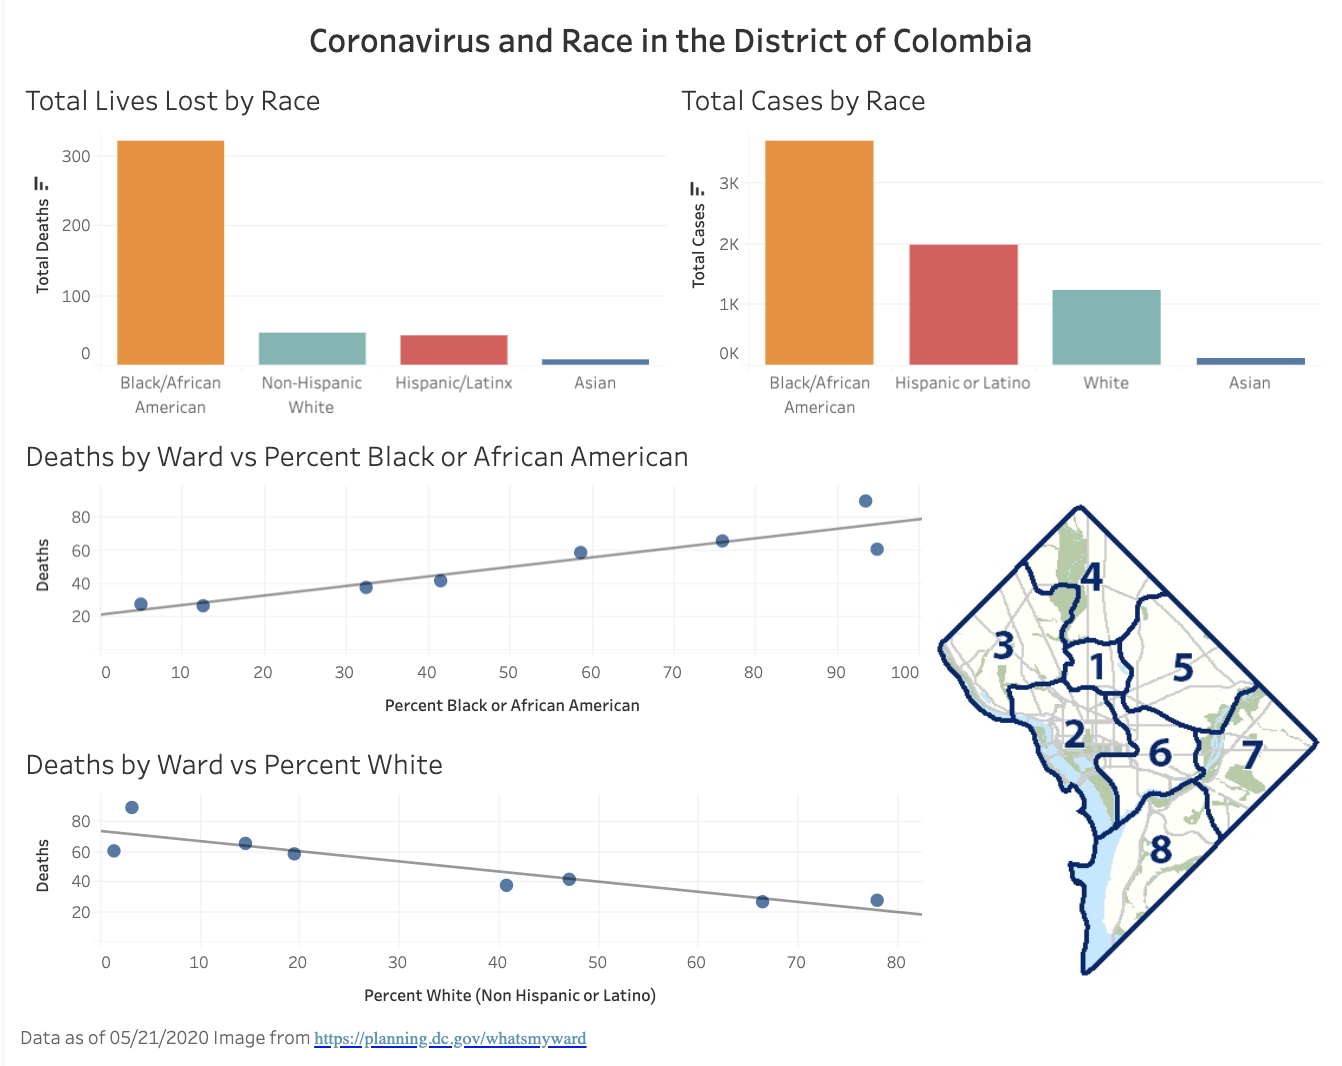
COVID-19 and Race in the District of Columbia
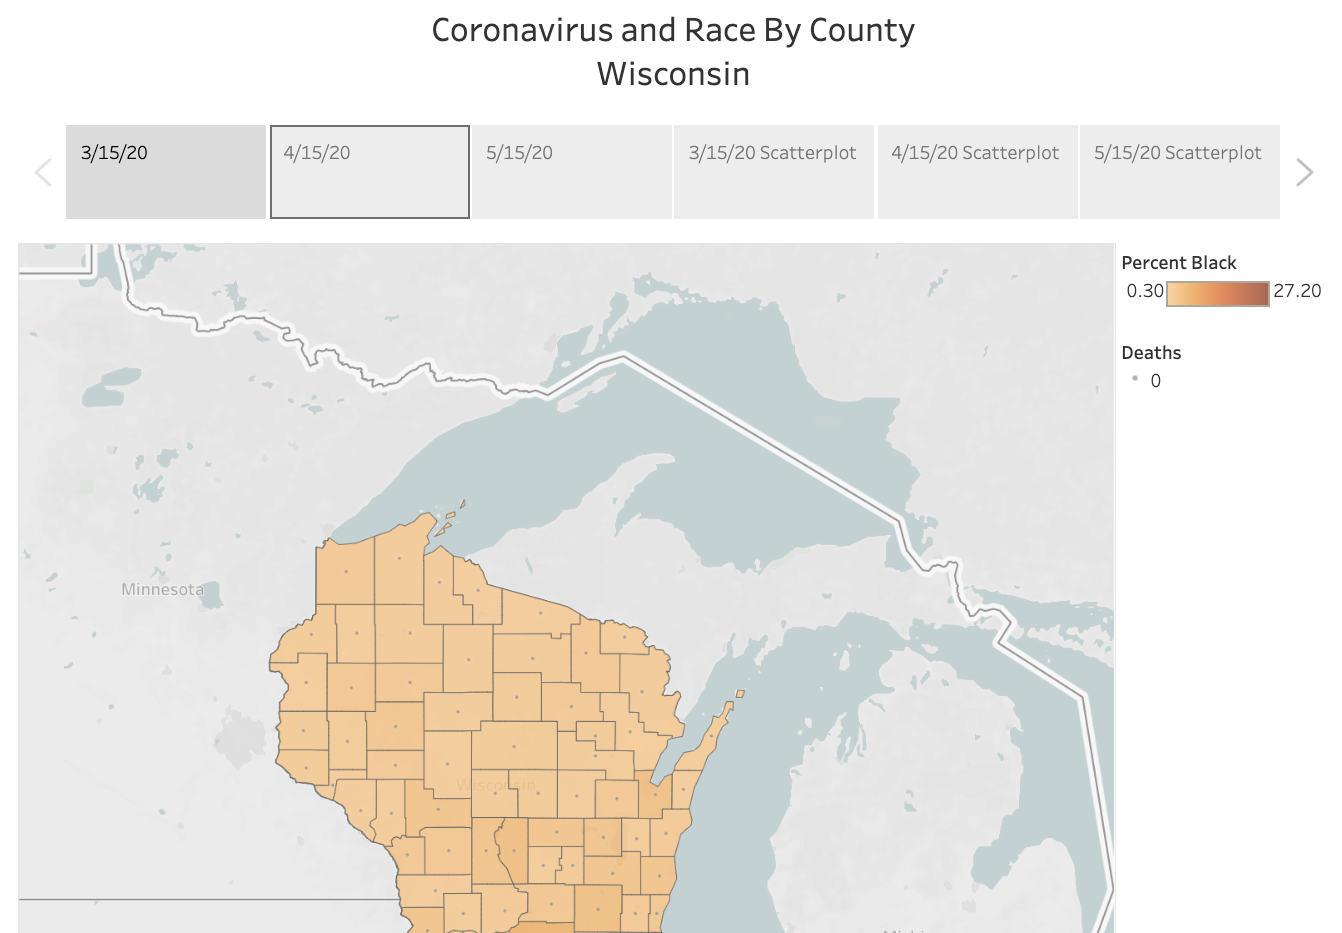
Coronavirus and Race By County Wisconsin
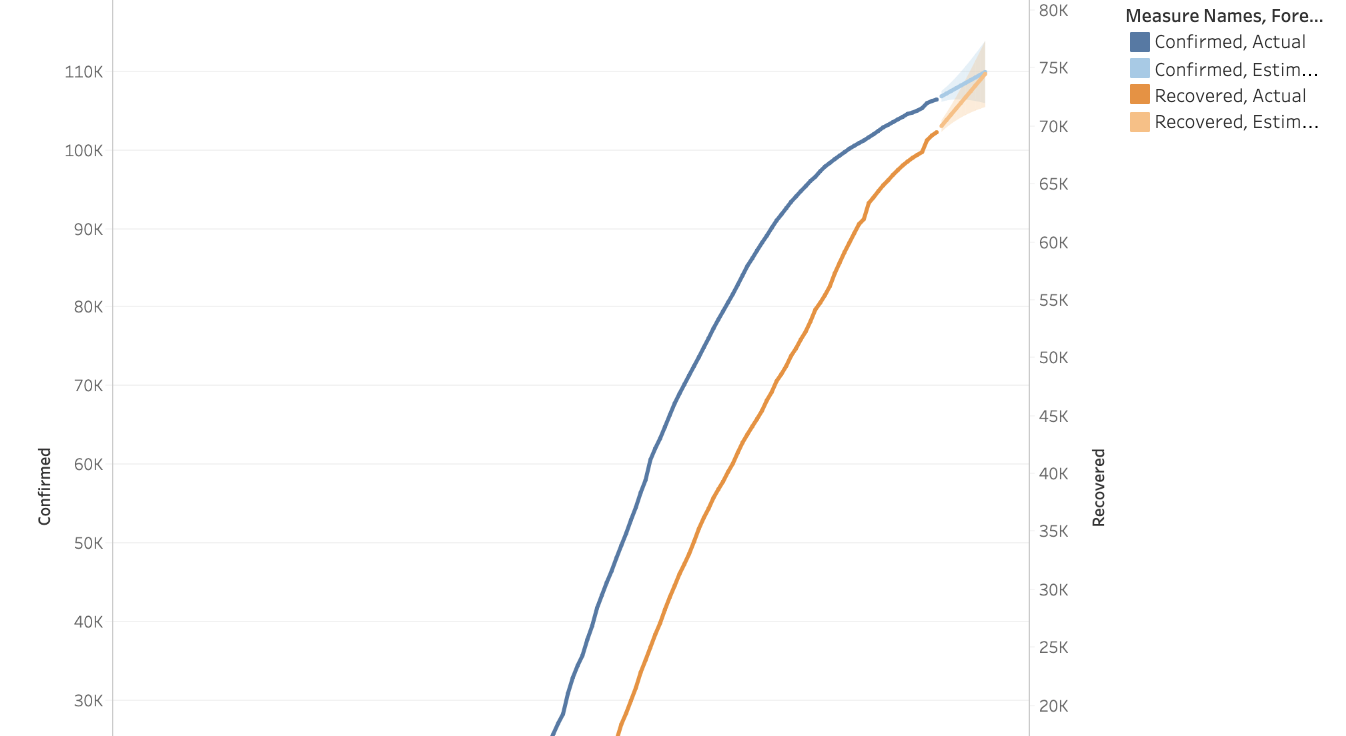
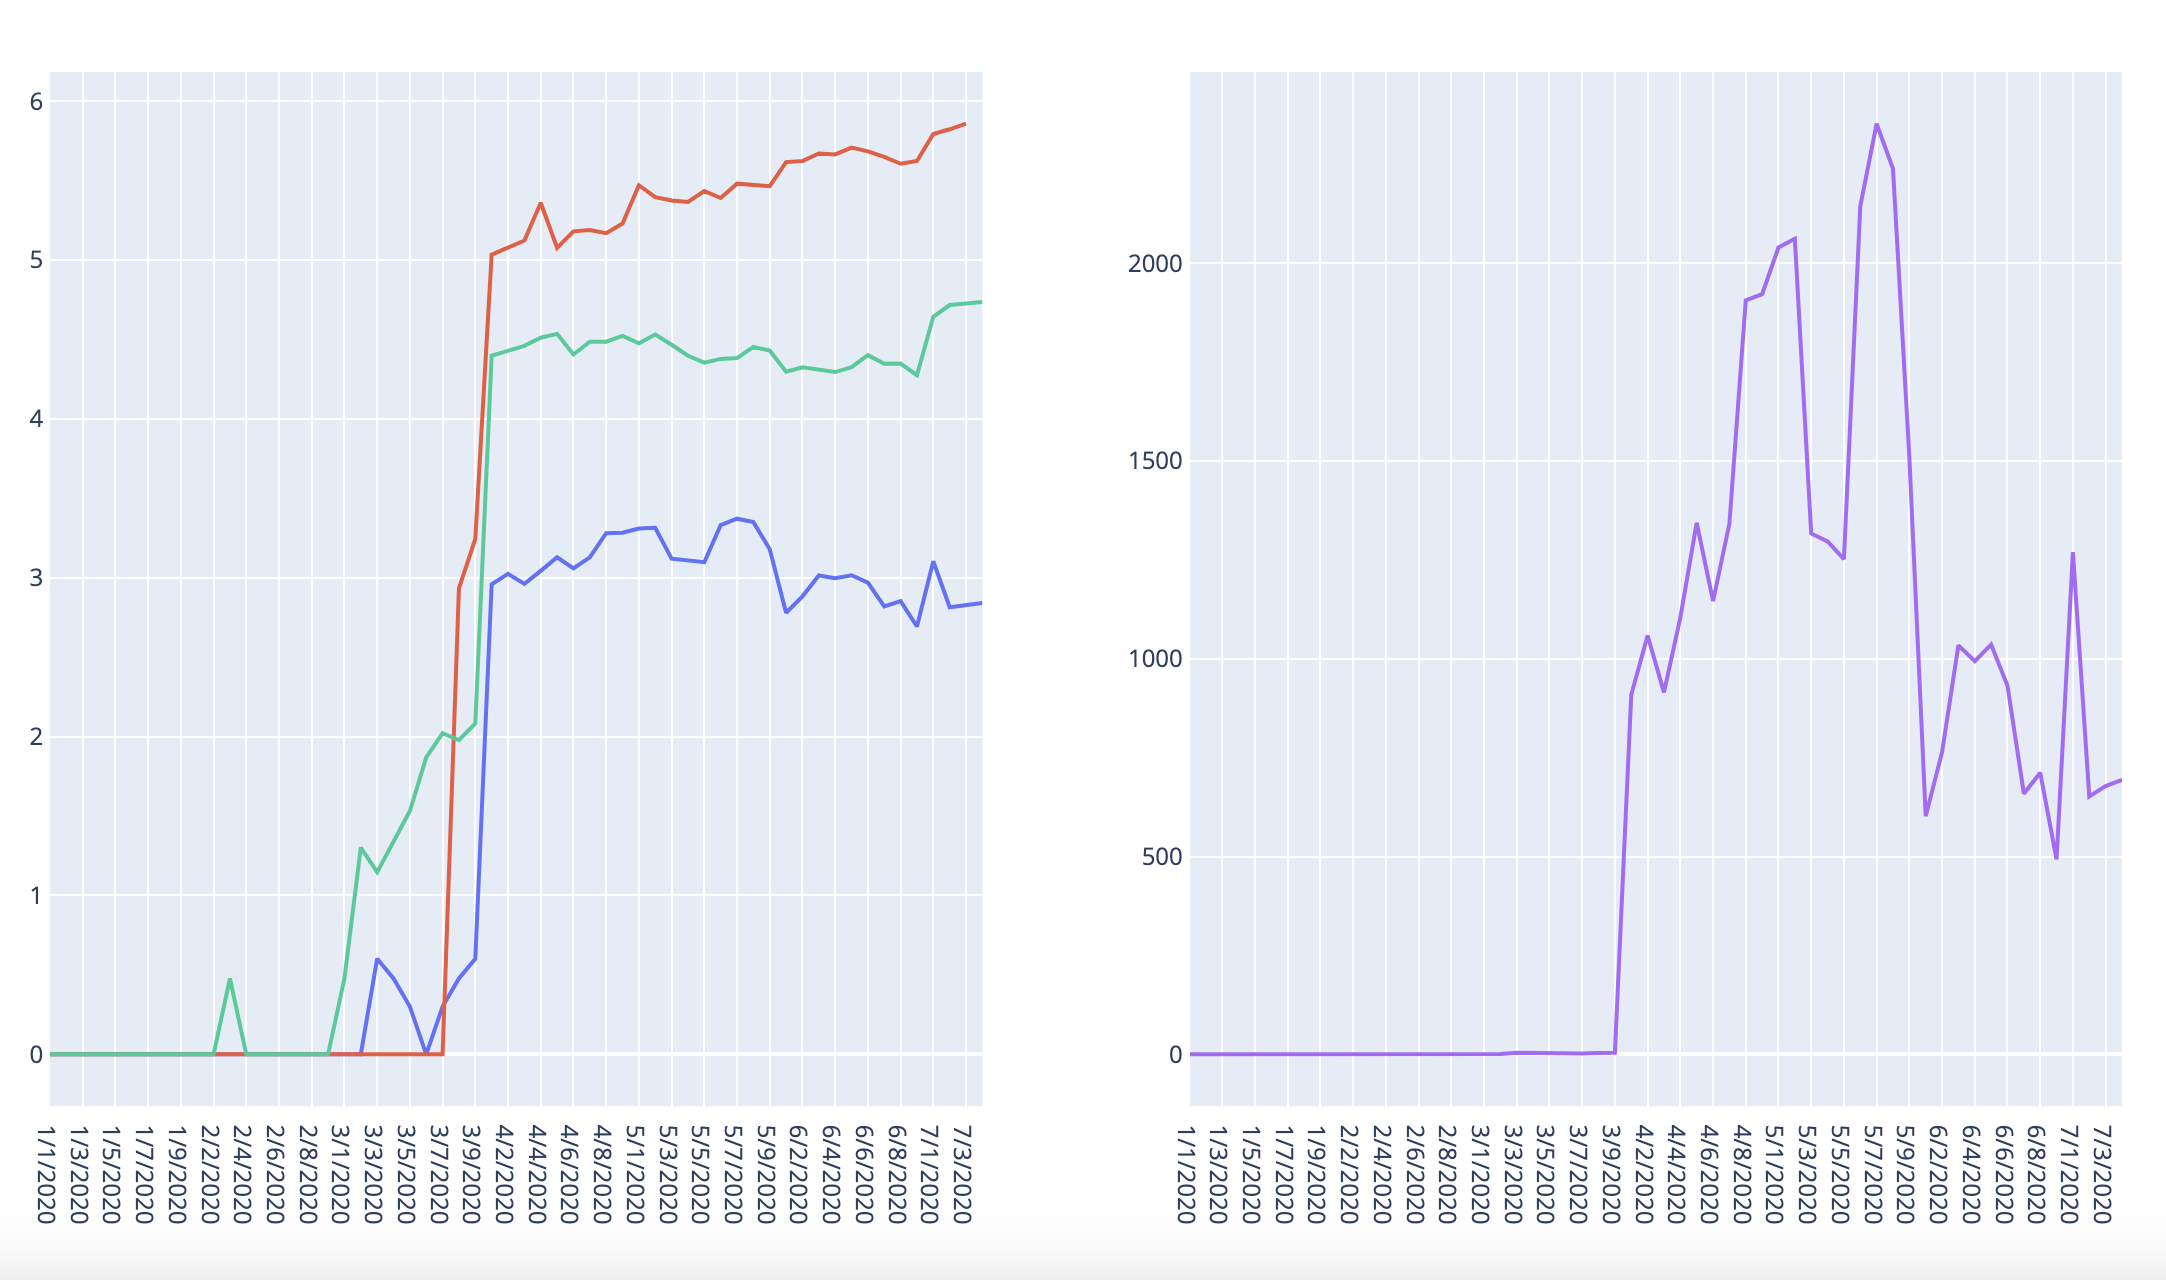
Confirmed Cases and Recovery Rates Over Time
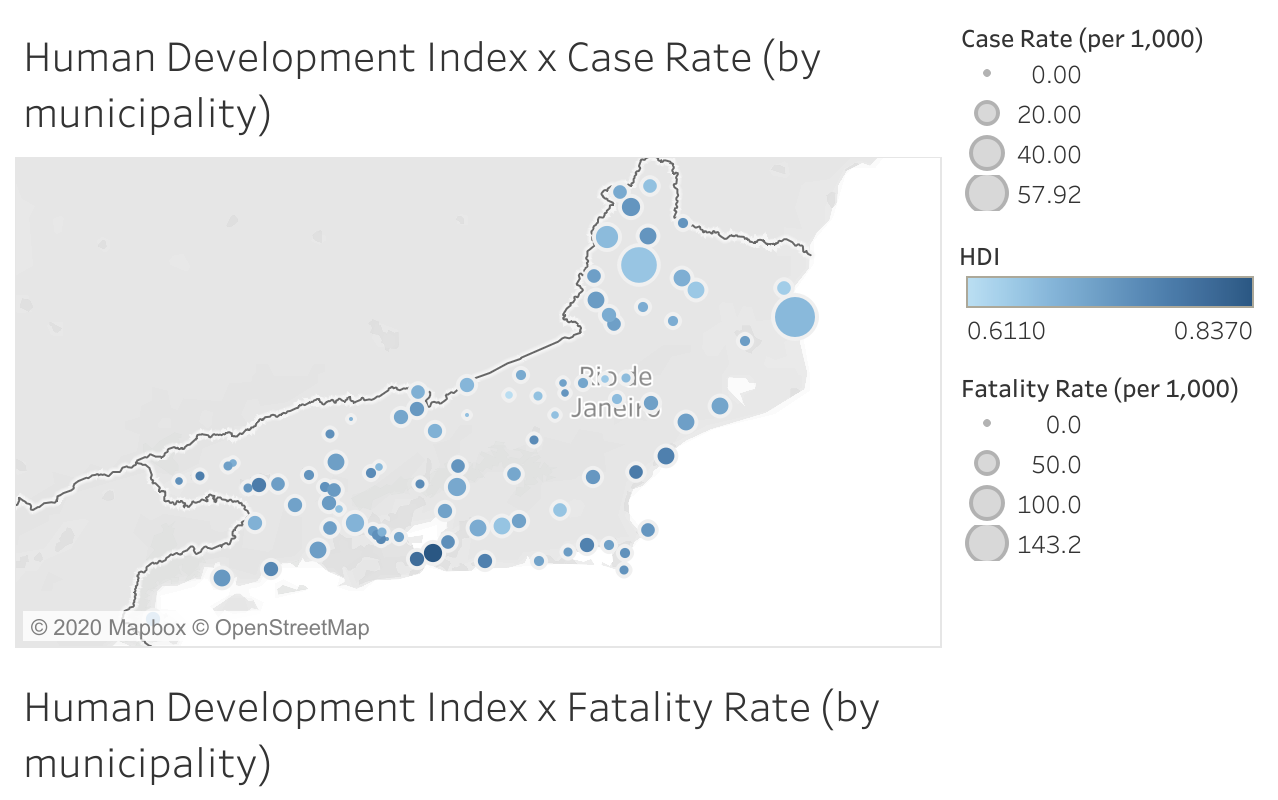
Rio de Janeiro State Overview
Risk Scores by County
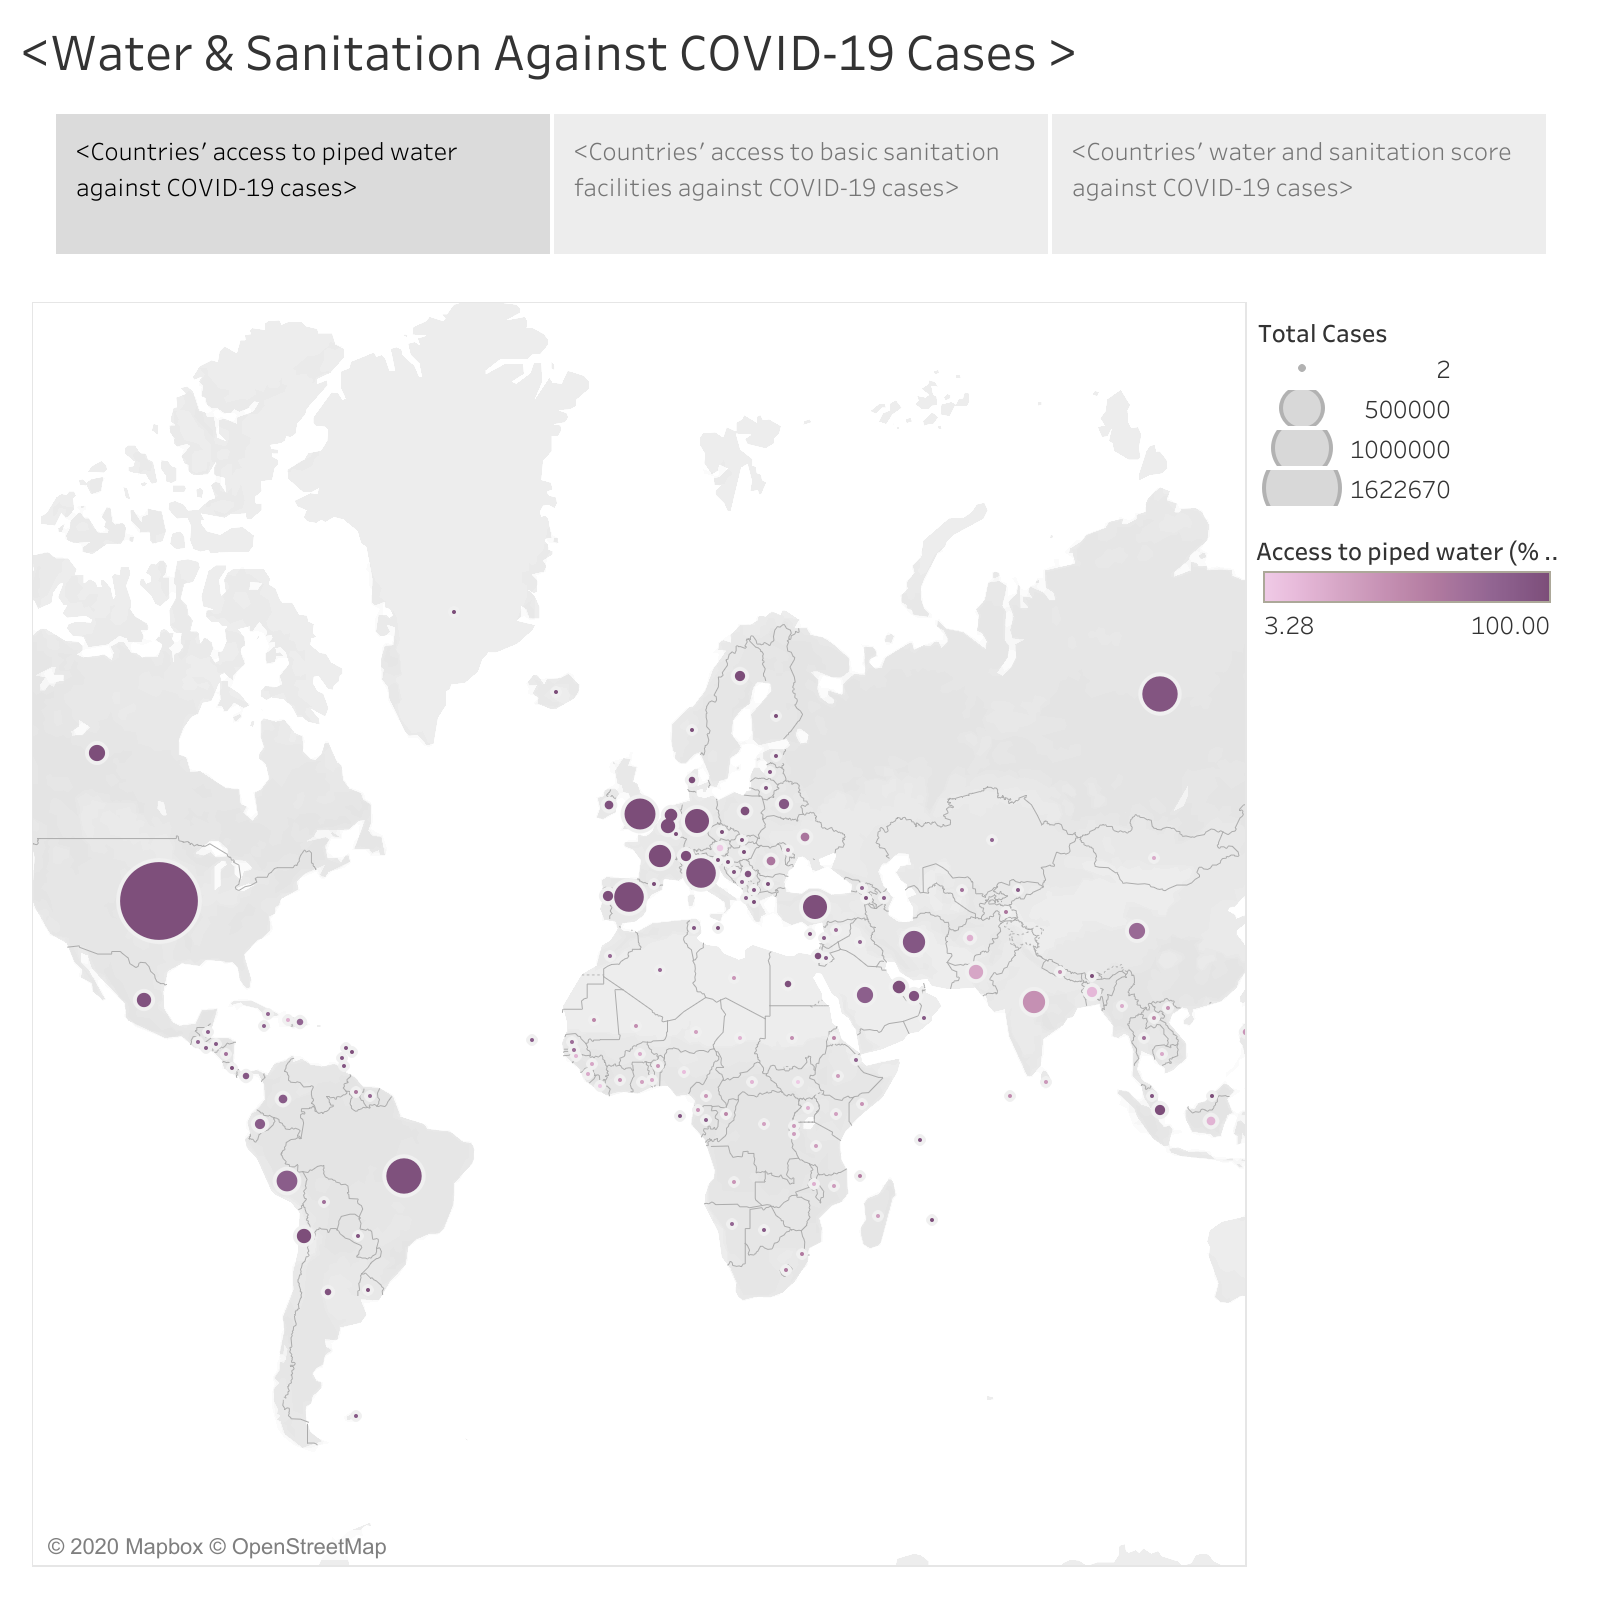
Water & Sanitation Against COVID-19 Cases
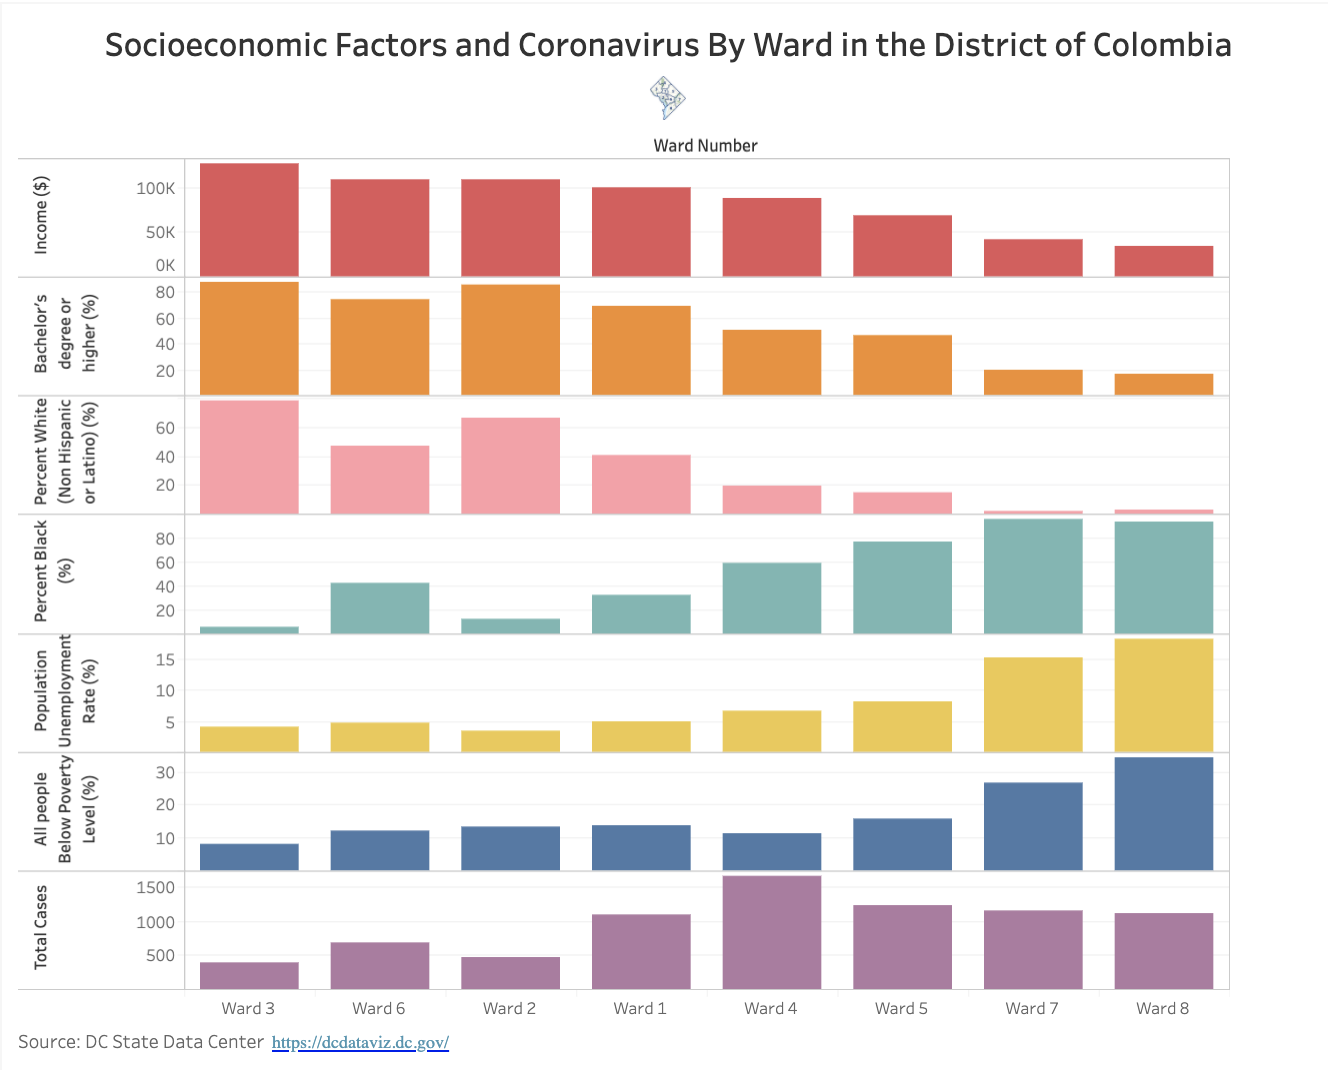
COVID-19 and Socioeconomic Factors by Ward in the District of Columbia
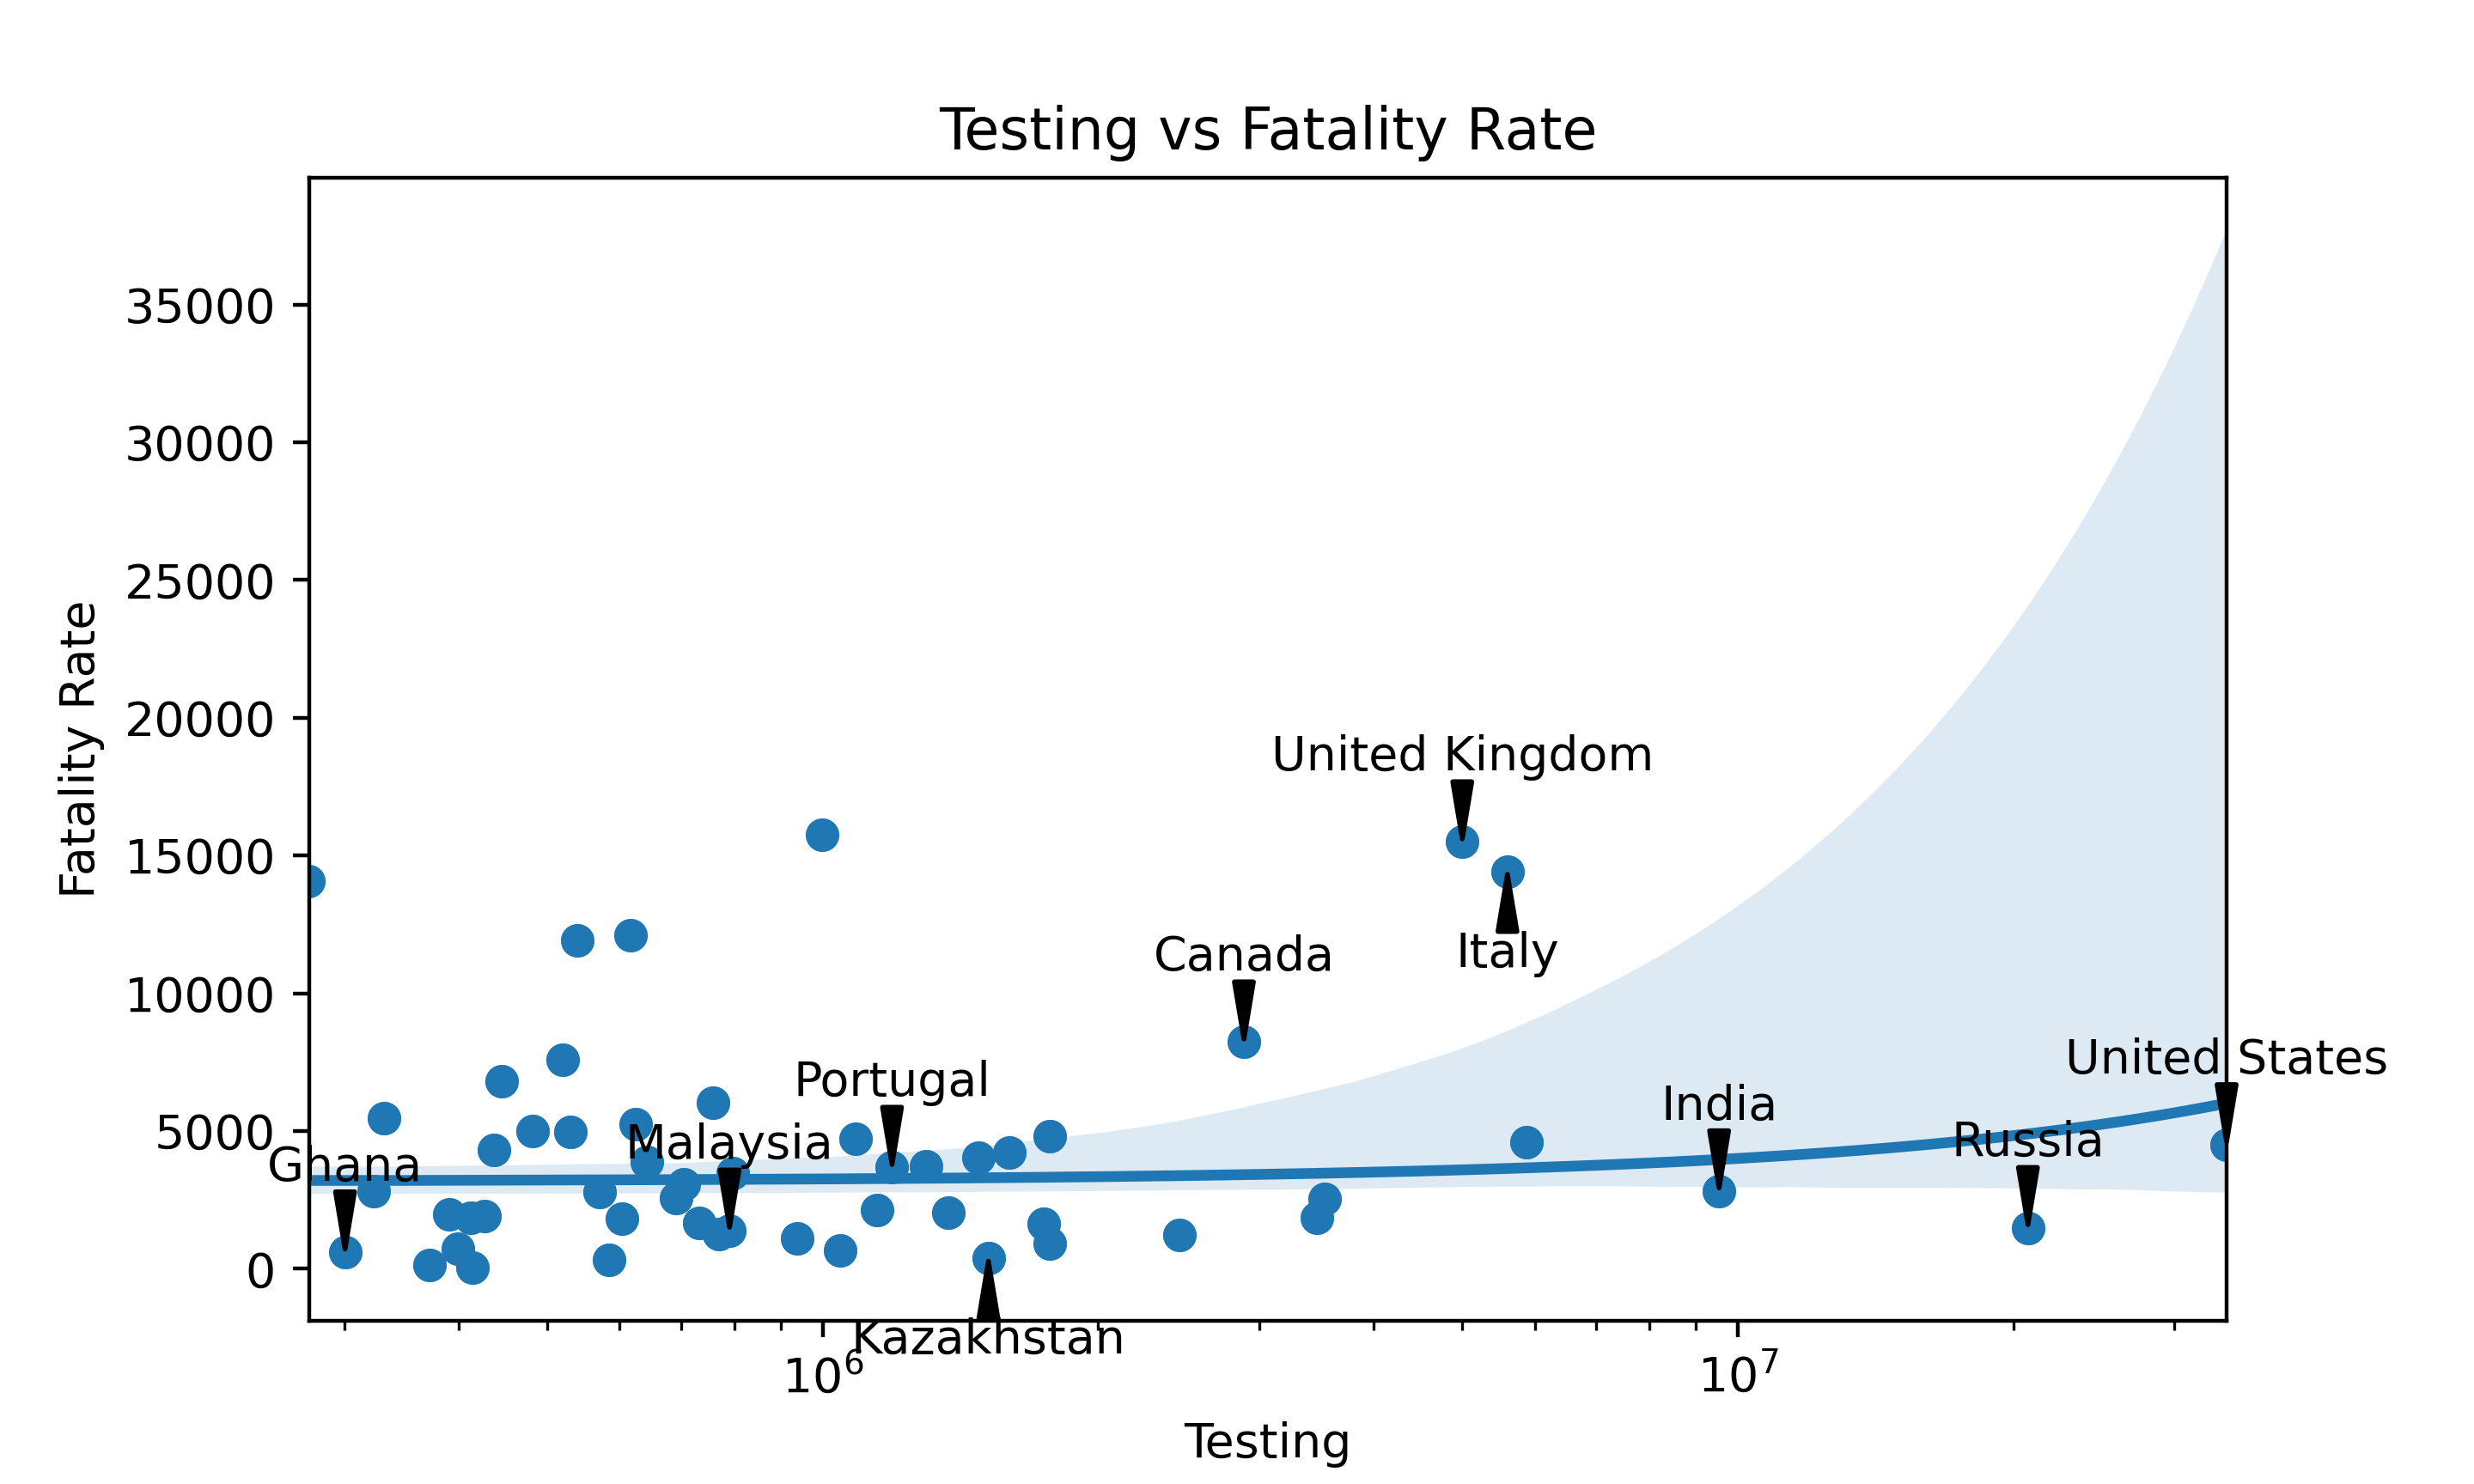
Testing vs. Fatality Rate
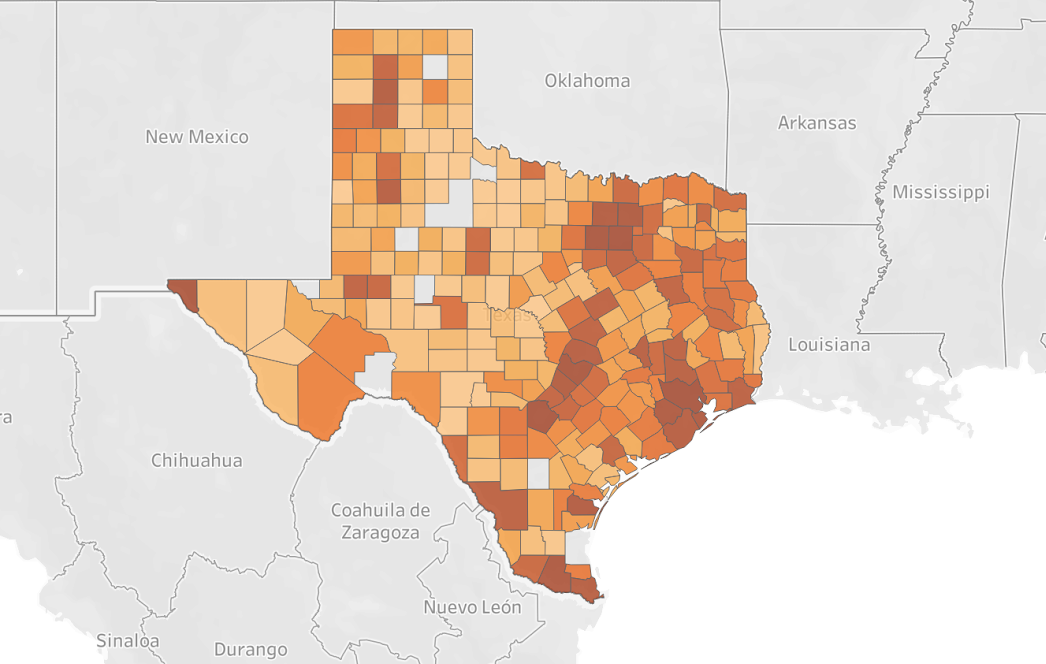
Map of Cases and Deaths in Texas as of July 4, 2020
Texas Hospitalizations Per Day
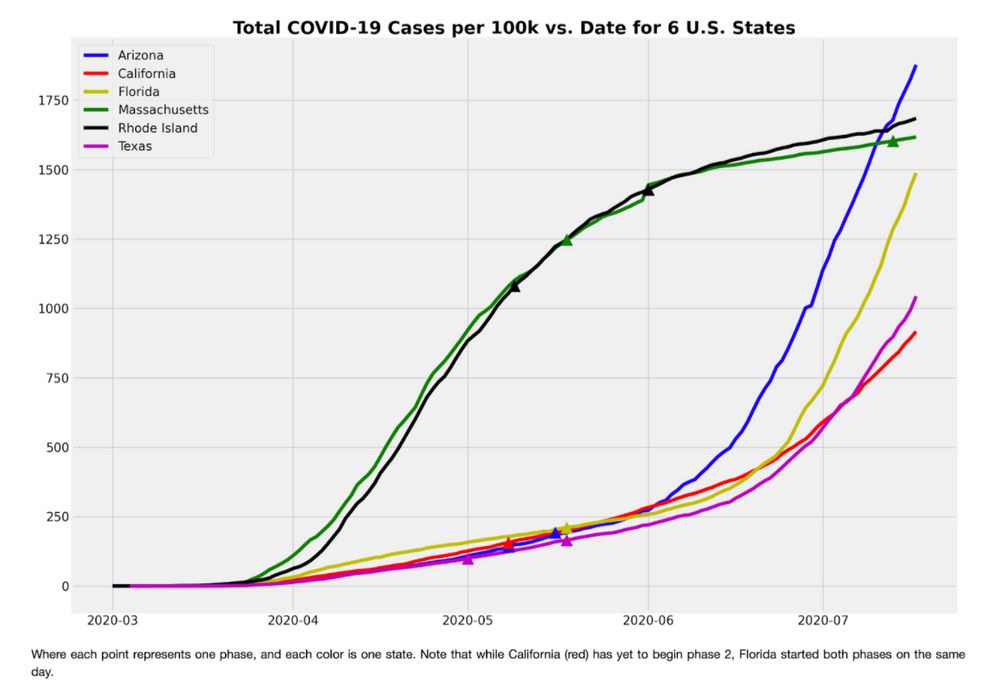
Total COVID-19 Cases per 100k vs. Date for 6 U.S. States
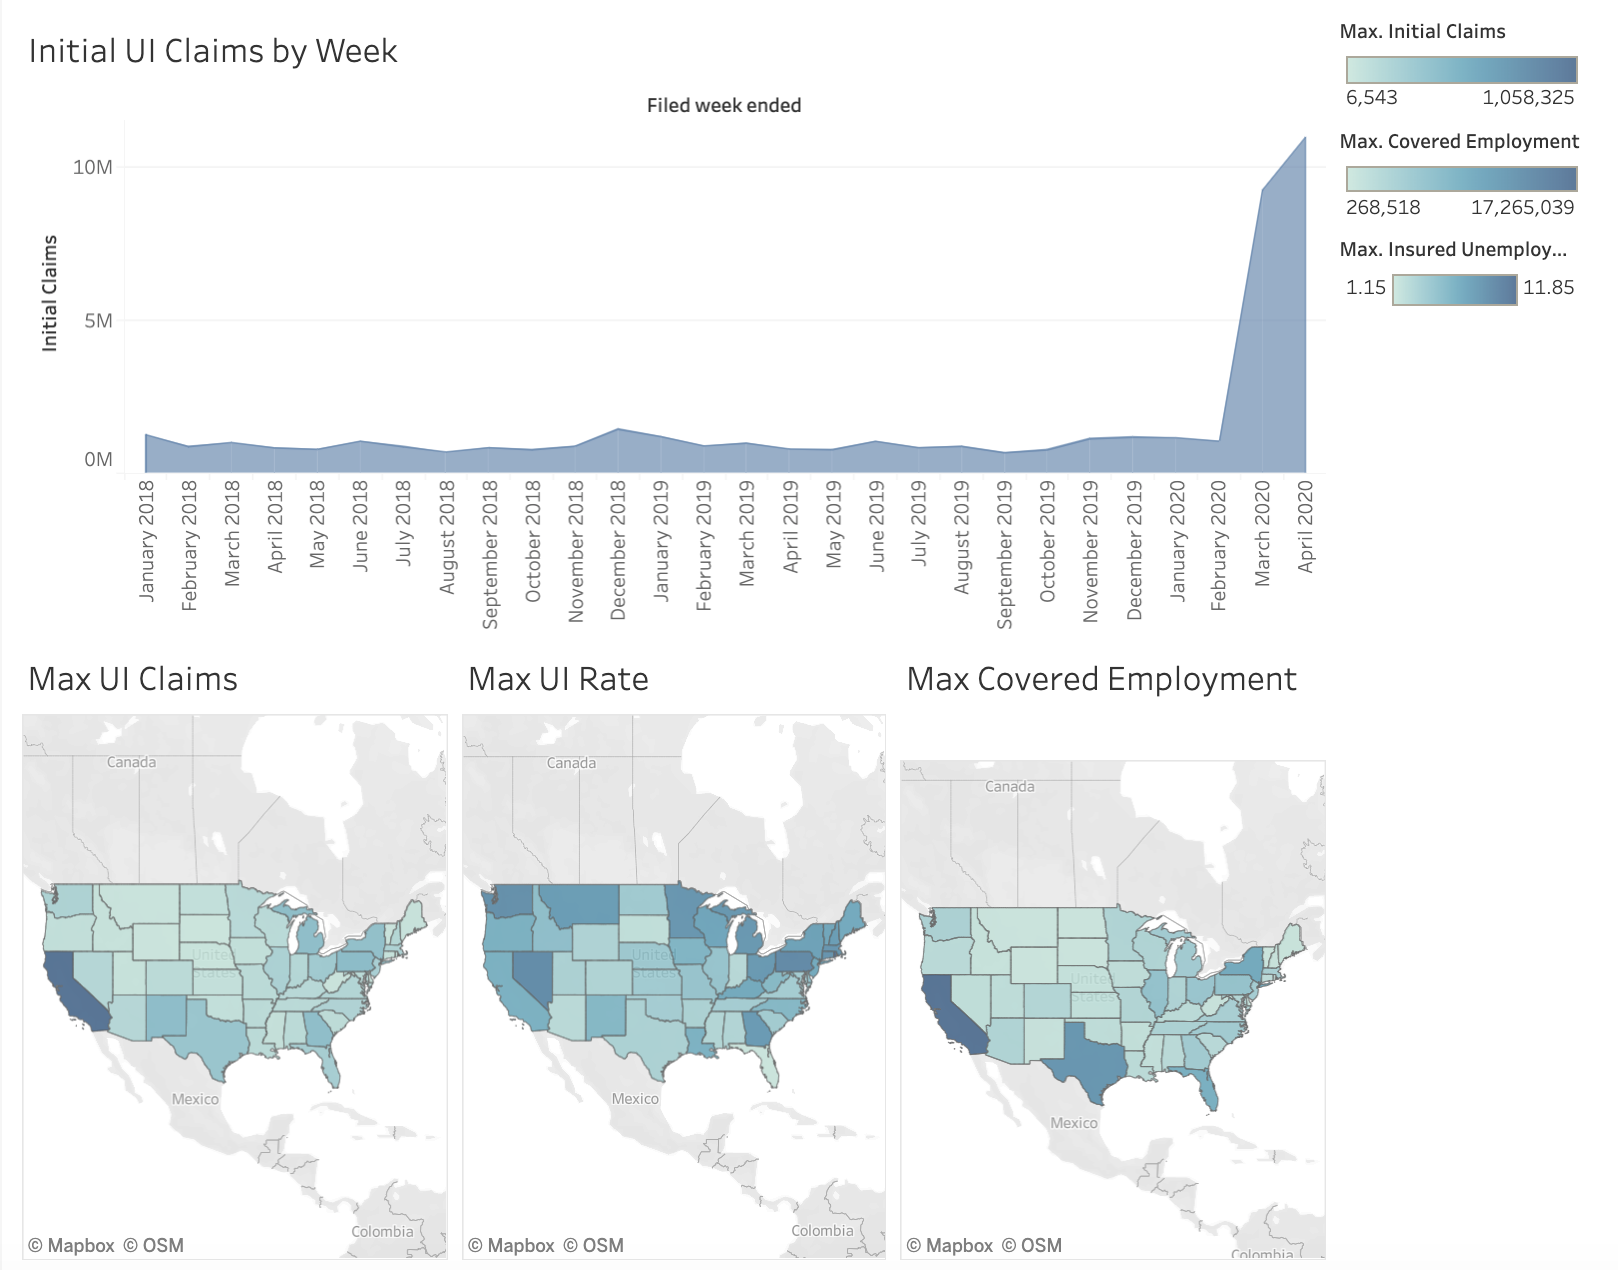
Unemployment Insurance Claims
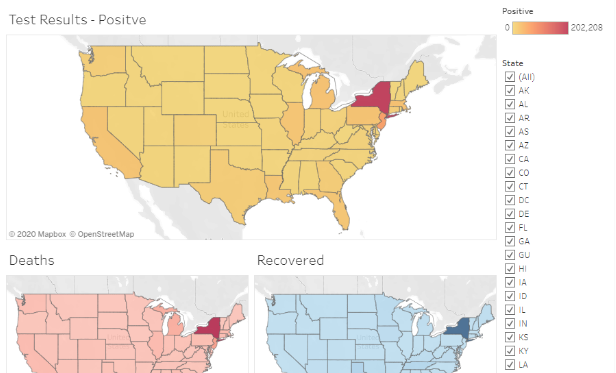
US COVID-19 Statistics
Change in New Deaths, Tests, and Cases Over Time in the US
More Projects
Inequalities Projects
Long Term Mental Health
Oasis

Xenophobia Online

Blood Donations

Breaking News
COVID & Climate Change

Environmental Influences on COVID-19

International Flight Tracking
Mental Health

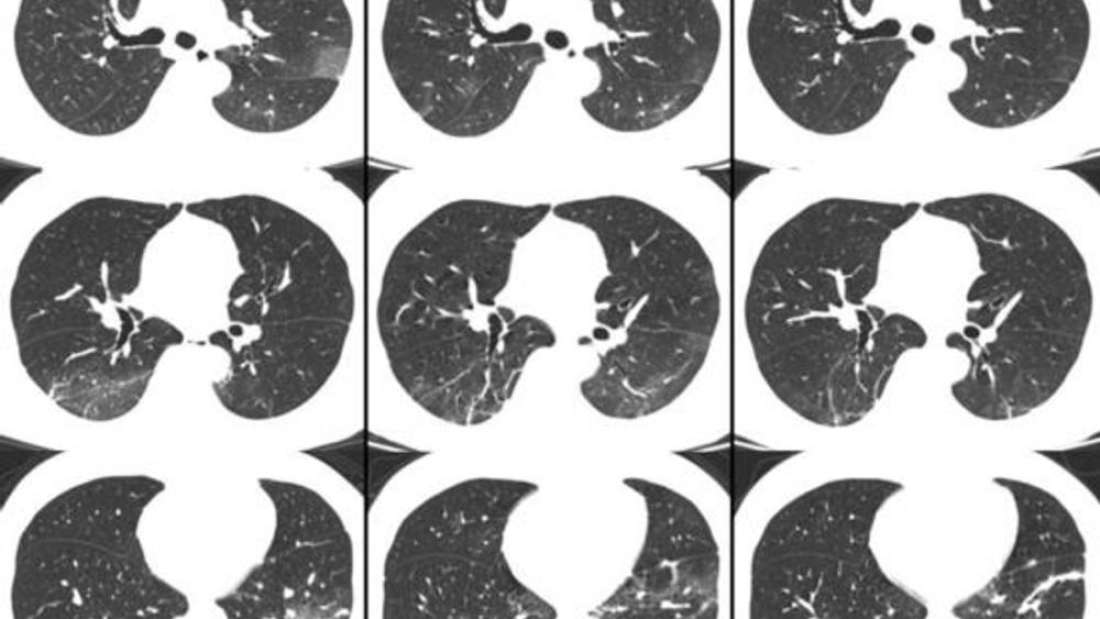
SARS-CoV-2 Lung CT Neural Network Classifier
Socioeconomic Factors

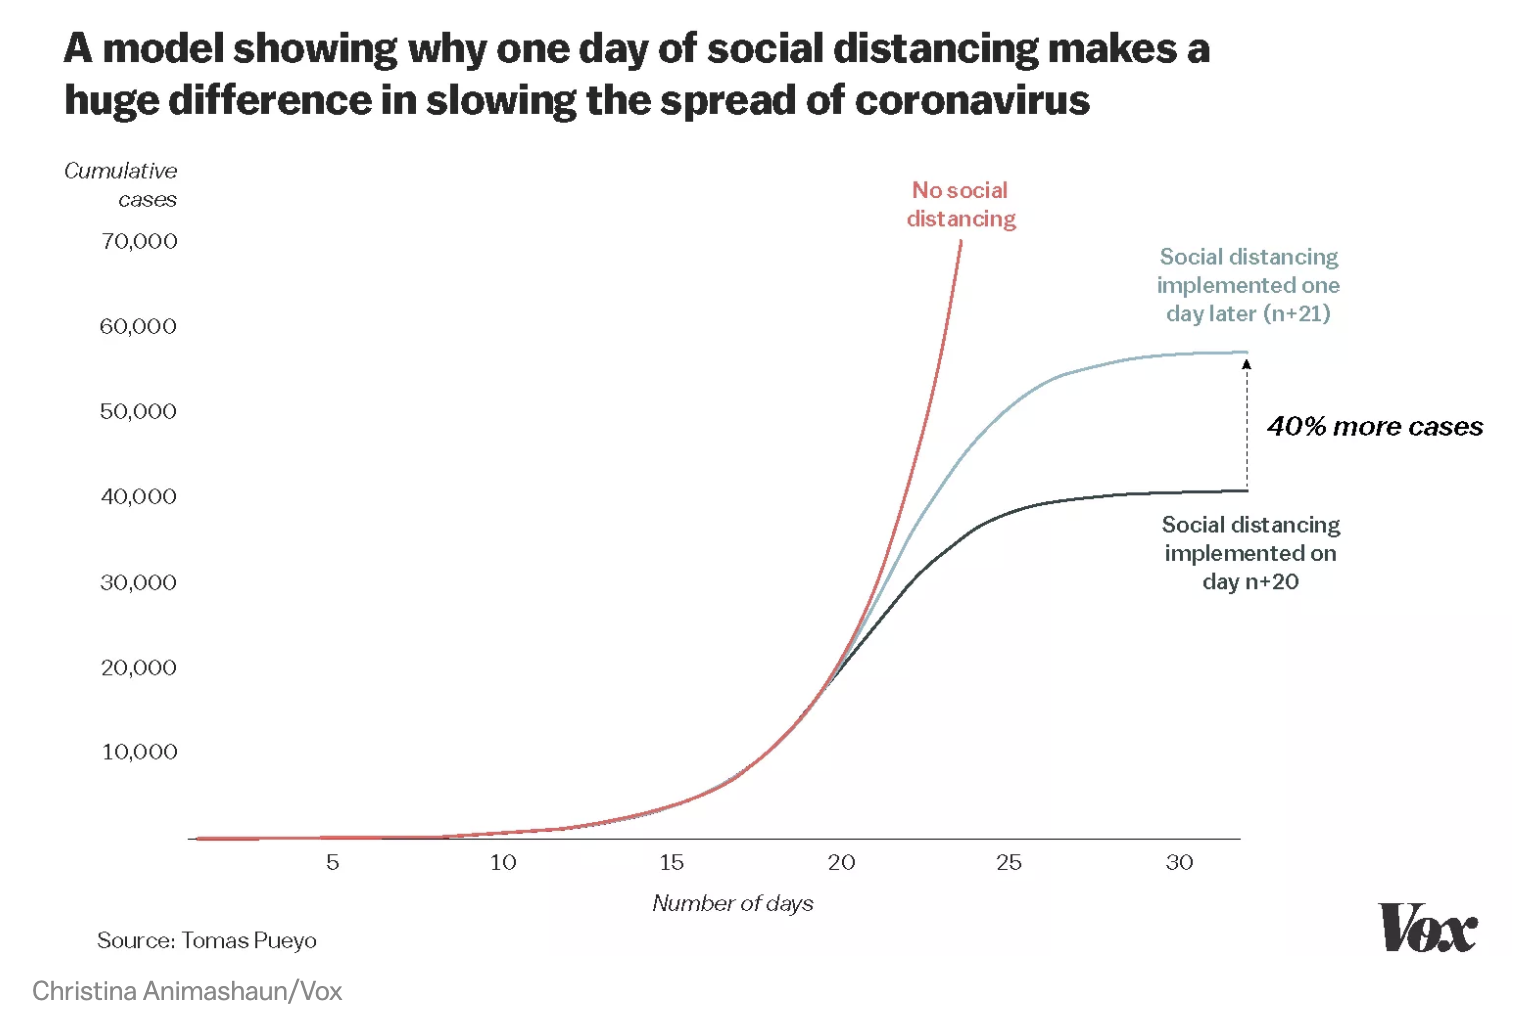
Why is COVID-19 spreading faster in certain areas?
CGA Project Showcase